Chevron 2008 Annual Report Download - page 48
Download and view the complete annual report
Please find page 48 of the 2008 Chevron annual report below. You can navigate through the pages in the report by either clicking on the pages listed below, or by using the keyword search tool below to find specific information within the annual report.-
 1
1 -
2
-
3
-
4
-
5
-
6
-
7
-
8
-
9
-
10
-
11
-
12
-
13
-
14
-
15
-
16
-
17
-
18
-
19
-
20
-
21
-
22
-
23
-
24
-
25
-
26
-
27
-
28
-
29
-
30
-
31
-
32
-
33
-
34
-
35
-
36
-
37
-
 38
38 -
 39
39 -
 40
40 -
 41
41 -
 42
42 -
 43
43 -
 44
44 -
 45
45 -
 46
46 -
 47
47 -
 48
48 -
 49
49 -
 50
50 -
 51
51 -
 52
52 -
 53
53 -
 54
54 -
 55
55 -
 56
56 -
 57
57 -
 58
58 -
59
-
60
-
61
-
62
-
63
-
64
-
65
-
66
-
67
-
68
-
69
-
70
-
71
-
72
-
73
-
74
-
75
-
76
-
77
-
78
-
79
-
80
-
81
-
82
-
83
-
84
-
85
-
86
-
87
-
88
-
89
-
90
-
91
-
92
-
93
-
94
-
95
-
96
-
97
-
98
-
99
-
100
-
101
-
102
-
103
-
104
-
105
-
106
-
107
-
108
-
109
-
110
-
111
-
112
 |
 |

Management’s Discussion and Analysis of
Financial Condition and Results of Operations
46 Chevron Corporation 2008 Annual Report
Factors” in Part I, Item 1A, of the company’s 2008 Annual
Report on Form 10-K.
Derivative Commodity Instruments Chevron is exposed
to market risks related to the price volatility of crude oil,
refined products, natural gas, natural gas liquids, liquefied
natural gas and refinery feedstocks.
The company uses derivative commodity instruments to
manage these exposures on a portion of its activity, including
firm commitments and anticipated transactions for the pur-
chase, sale and storage of crude oil, refined products, natural
gas, natural gas liquids and feedstock for company refineries.
The company also uses derivative commodity instruments for
limited trading purposes. The results of this activity were not
material to the company’s financial position, net income or
cash flows in 2008.
The company’s market exposure positions are moni-
tored and managed on a daily basis by an internal Risk
Control group to ensure compliance with the company’s risk
management policies that have been approved by the Audit
Committee of the company’s Board of Directors.
The derivative instruments used in the company’s risk
management and trading activities consist mainly of futures,
options and swap contracts traded on the NYMEX (New
York Mercantile Exchange) and on electronic platforms of
ICE (Inter-Continental Exchange) and GLOBEX (Chicago
Mercantile Exchange). In addition, crude oil, natural gas
and refined-product swap contracts and option contracts are
entered into principally with major financial institutions and
other oil and gas companies in the “over-the-counter” markets.
Virtually all derivatives beyond those designated as nor-
mal purchase and normal sale contracts are recorded at fair
value on the Consolidated Balance Sheet with resulting gains
and losses reflected in income. Fair values are derived prin-
cipally from published market quotes and other independent
third-party quotes. The change in fair value from Chevron’s
derivative commodity instruments in 2008 was a quarterly
average increase of $160 million in total assets and a quar-
terly average decrease of $1 million in total liabilities.
The company uses a Value-at-Risk (VaR) model to esti-
mate the potential loss in fair value on a single day from the
effect of adverse changes in market conditions on derivative
instruments held or issued, which are recorded on the bal-
ance sheet at December 31, 2008, as derivative instruments
in accordance with FAS Statement No. 133, “Accounting for
Derivative Instruments and Hedging Activities,” as amended
(FAS 133). VaR is the maximum loss not to be exceeded
within a given probability or confidence level over a given
period of time. The company’s VaR model uses the Monte
Carlo simulation method that involves generating hypotheti-
cal scenarios from the specified probability distribution and
constructing a full distribution of a portfolio’s potential values.
The VaR model utilizes an exponentially weighted
moving average for computing historical volatilities and
correlations, a 95 percent confidence level, and a one-day
holding period. That is, the company’s 95 percent, one-day
VaR corresponds to the unrealized loss in portfolio value that
would not be exceeded on average more than one in every 20
trading days, if the portfolio were held constant for one day.
The one-day holding period is based on the assump-
tion that market-risk positions can be liquidated or hedged
within one day. For hedging and risk management, the com-
pany uses conventional exchange-traded instruments such as
futures and options as well as non-exchange-traded swaps,
most of which can be liquidated or hedged effectively within
one day. The table below presents the 95 percent/one-day
VaR for each of the company’s primary risk exposures in the
area of derivative commodity instruments at December 31,
2008 and 2007. The higher amounts in 2008 were associated
with an increase in price volatility for these commodities dur-
ing the year.
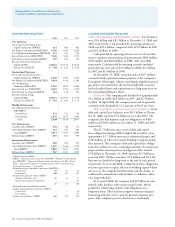
Millions of dollars 2008 2007
Crude Oil $ 39 $ 29
Natural Gas 5 3
Refined Products 45 23
Foreign Currency The company enters into forward
exchange contracts, generally with terms of 180 days or less,
to manage some of its foreign currency exposures. These expo-
sures include revenue and anticipated purchase transactions,
including foreign currency capital expenditures and lease com-
mitments, forecasted to occur within 180 days. The forward
exchange contracts are recorded at fair value on the balance
sheet with resulting gains and losses reflected in income.
The aggregate effect of a hypothetical 10 percent
increase in the value of the U.S. dollar at year-end 2008
would be a reduction in the fair value of the foreign exchange
contracts of approximately $100 million. The effect would
be the opposite for a hypothetical 10 percent decrease in the
value of the U.S. dollar at year-end 2008.
Interest Rates The company enters into interest-rate swaps
from time to time as part of its overall strategy to manage the
interest-rate risk on its debt. Under the terms of the swaps, net
cash settlements are based on the difference between fixed-rate
and floating-rate interest amounts calculated by reference to
agreed notional principal amounts. Interest-rate swaps related
to a portion of the company’s fixed-rate debt are accounted
for as fair value hedges. Interest-rate swaps related to floating-
rate debt are recorded at fair value on the balance sheet with
resulting gains and losses reflected in income. At year-end
2008, the company had no interest-rate swaps on floating-rate
debt. The company’s only interest-rate swaps on fixed-rate
debt matured in January 2009.