Chevron 2008 Annual Report Download - page 41
Download and view the complete annual report
Please find page 41 of the 2008 Chevron annual report below. You can navigate through the pages in the report by either clicking on the pages listed below, or by using the keyword search tool below to find specific information within the annual report.-
 1
1 -
2
-
3
-
4
-
5
-
6
-
7
-
8
-
9
-
10
-
11
-
12
-
13
-
14
-
15
-
16
-
17
-
18
-
19
-
20
-
21
-
22
-
23
-
24
-
25
-
26
-
27
-
28
-
29
-
30
-
 31
31 -
 32
32 -
 33
33 -
 34
34 -
 35
35 -
 36
36 -
 37
37 -
 38
38 -
 39
39 -
 40
40 -
 41
41 -
 42
42 -
 43
43 -
 44
44 -
 45
45 -
 46
46 -
 47
47 -
 48
48 -
 49
49 -
 50
50 -
 51
51 -
52
-
53
-
54
-
55
-
56
-
57
-
58
-
59
-
60
-
61
-
62
-
63
-
64
-
65
-
66
-
67
-
68
-
69
-
70
-
71
-
72
-
73
-
74
-
75
-
76
-
77
-
78
-
79
-
80
-
81
-
82
-
83
-
84
-
85
-
86
-
87
-
88
-
89
-
90
-
91
-
92
-
93
-
94
-
95
-
96
-
97
-
98
-
99
-
100
-
101
-
102
-
103
-
104
-
105
-
106
-
107
-
108
-
109
-
110
-
111
-
112
 |
 |

Chevron Corporation 2008 Annual Report 39
Income in 2007 of $10.3 billion increased $1.4 bil-
lion from 2006. Earnings in 2007 benefited approximately
$1.6 billion from higher prices, primarily for crude oil, and
$300 million from increased liftings. Non-recurring income-
tax items also benefited earnings between periods. These
benefits to income were partially offset by the impact of
higher operating and depreciation expenses.
The company’s average realization for crude oil and natu-
ral gas liquids in 2008 was $86.51 per barrel, compared with
$65.01 in 2007 and $57.65 in 2006. The average natural gas
realization was $5.19 per thousand cubic feet in 2008, com-
pared with $3.90 and $3.73 in 2007 and 2006, respectively.
Net oil-equivalent production of 1.86 million barrels
per day in 2008 declined about 1 percent and 2 percent from
2007 and 2006, respectively. The volumes for each year
included production from oil sands in Canada. Volumes in
2006 also included production under an operating service
agreement in Venezuela until its conversion to a joint-stock
company in October of that year. Absent the impact of
higher prices on certain production-sharing and variable-
royalty agreements, net oil-equivalent production increased
between 2007 and 2008. The decline in 2007 from 2006
was associated with the impact of the contract conversion in
Venezuela and the impact of higher prices on production-
sharing agreements.
The net liquids component of oil-equivalent production
was 1.3 million barrels per day in 2008, a decrease of 5 per-
cent from 2007 and 9 percent from 2006. Net natural gas
production of 3.6 billion cubic feet per day in 2008 was up
9 percent and 15 percent from 2007 and 2006, respectively.
Refer to the “Selected Operating Data” table, on page
42, for the three-year comparative of international pro-
duction volumes.
U.S. Downstream – Refining, Marketing and Transportation
Millions of dollars 2008 2007 2006
Income $ 1,369 $ 966 $ 1,938
U.S downstream earnings of $1.4 billion in 2008
increased about $400 million from 2007 due mainly to
improved margins on the sale of refined products and gains
on derivative commodity instruments. Operating expenses
were higher between periods. Income of $966 million in
2007 decreased nearly $1 billion from 2006. The decline
was associated mainly with lower refined-product margins
and higher planned and unplanned refinery downtime than
a year earlier. Operating expenses were also higher in 2007
than in 2006.
Sales volumes of refined products were 1.41 million bar-
rels per day in 2008, a decrease of 3 percent from 2007. The
decline was associated with reduced sales of gasoline and
fuel oil. Sales volumes of refined products were 1.46 million
barrels per day in 2007, a decrease of 3 percent from 2006.
The reported sales volume for 2007 was on a different basis
than 2006 due to a change in accounting rules that became
effective April 1, 2006, for certain purchase-and-sale (buy/
sell) contracts with the same counterparty. Excluding the
0
1600
1200
800
400
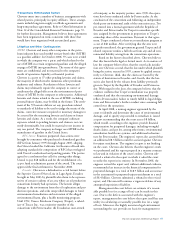
U.S. Gasoline & Other
Rened-Product Sales
Thousands of barrels per day
Gasoline
Jet Fuel
Gas Oils & Kerosene
Residual Fuel Oil
Other
Refined-product sales volumes
decreased about 3 percent from
2007 on lower sales of gasoline
and fuel oil.
1,413
0504 06 07 08
0.0
4.5
4.0
3.5
3.0
2.5
0.5
2.0
1.0
1.5
Downstream earnings decreased
2 percent from 2007, which
included $1.1 billion of gains on
asset sales. Earnings in 2008
benefited from higher margins on
the sale of refined products and
improved refinery operations.
*Includes equity in affiliates
United States
International
Worldwide Rening, Marketing
& Transportation Earnings*
Billions of dollars
0504 06 07 08
$3.4
impact of this accounting standard, refined-product sales in
2007 decreased 1 percent from 2006. Branded gasoline sales
volumes of 601,000 barrels per day in 2008 were down about
4 percent and 2 percent from 2007 and 2006, respectively.
Refer to the “Selected Operating Data” table on page
42 for a three-year comparative of sales volumes of gaso-
line and other refined products and refinery-input volumes.
Refer also to Note 14, “Accounting for Buy/Sell Contracts,”
on page 74 for a discussion of the accounting for purchase-
and-sale contracts with the same counterparty.
International Downstream – Refining, Marketing and Transportation
Millions of dollars 2008 2007 2006
Income* $ 2,060 $ 2,536 $ 2,035
*Includes Foreign Currency Effects: $ 193 $ 62 $ 98
International downstream income of $2.1 billion in
2008 decreased nearly $500 million from 2007. Earnings
in 2007 included gains of approximately $1 billion on the
sale of assets, which included an interest in a refinery and
marketing assets in the Benelux region of Europe. The
$500 million improvement otherwise between years was asso-
ciated primarily with a benefit from gains on derivative
commodity instruments that was only partially offset by the
impact of lower margins on the sale of refined products. For-
eign currency effects increased earnings by $193 million in
2008, compared with $62 million in 2007. Income in 2007
of $2.5 billion increased $500 million from 2006, largely
due to the gains on asset sales. Margins on the sale of refined
products in 2007 were up slightly from 2006. Operating
expenses were higher, and earnings from the company’s ship-
ping operations were lower.