Chevron 2008 Annual Report Download - page 6
Download and view the complete annual report
Please find page 6 of the 2008 Chevron annual report below. You can navigate through the pages in the report by either clicking on the pages listed below, or by using the keyword search tool below to find specific information within the annual report.-
 1
1 -
 2
2 -
 3
3 -
 4
4 -
 5
5 -
 6
6 -
 7
7 -
 8
8 -
 9
9 -
 10
10 -
 11
11 -
 12
12 -
 13
13 -
 14
14 -
 15
15 -
 16
16 -
 17
17 -
18
-
19
-
20
-
21
-
22
-
23
-
24
-
25
-
26
-
27
-
28
-
29
-
30
-
31
-
32
-
33
-
34
-
35
-
36
-
37
-
38
-
39
-
40
-
41
-
42
-
43
-
44
-
45
-
46
-
47
-
48
-
49
-
50
-
51
-
52
-
53
-
54
-
55
-
56
-
57
-
58
-
59
-
60
-
61
-
62
-
63
-
64
-
65
-
66
-
67
-
68
-
69
-
70
-
71
-
72
-
73
-
74
-
75
-
76
-
77
-
78
-
79
-
80
-
81
-
82
-
83
-
84
-
85
-
86
-
87
-
88
-
89
-
90
-
91
-
92
-
93
-
94
-
95
-
96
-
97
-
98
-
99
-
100
-
101
-
102
-
103
-
104
-
105
-
106
-
107
-
108
-
109
-
110
-
111
-
112
 |
 |

4
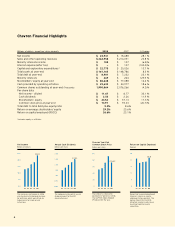
Millions of dollars, except per-share amounts 2008 2007 % Change
Net income $ 23,931$ 18,68828.1%
Sales and other operating revenues $264,958$214,09123.8%
Minority interests income $ 100$107(6.5)%
Interest expense (after tax) $ —$107(100.0)%
Capital and exploratory expenditures* $ 22,775$20,02613.7%
Total assets at year-end $161,165$148,7868.3%
Total debt at year-end $ 8,901$7,23223.1%
Minority interests $ 469$204 129.9%
Stockholders’ equity at year-end $ 86,648$77,08812.4%
Cash provided by operating activities $ 29,632$24,97718.6%
Common shares outstanding at year-end (Thousands) 1,990,0642,076,266 (4.2)%
Per-share data
Net income – diluted $ 11.67$8.7733.1 %
Cash dividends $ 2.53$2.2611.9 %
Stockholders’ equity $ 43.54$37.1317.3 %
Common stock price at year-end $ 73.97$93.33(20.7)%
Total debt to total debt-plus-equity ratio 9.3% 8.6%
Return on average stockholders’ equity 29.2% 25.6%
Return on capital employed (ROCE) 26.6% 23.1%
Chevron Financial Highlights
*Includes equity in afliates
0.0
25.0
20.0
15.0
5.0
10.0
Net Income
Billions of dollars
The increase in net income in 2008
was due mainly to improved earnings
for upstream, which were driven by
higher prices for crude oil and
natural gas.
04 06 07 08
$23.9
05
0.00
2.50
2.00
1.50
1.00
0.50
3.00
Annual Cash Dividends
Dollars per share
The company increased its annual
dividend payout for the 21st
consecutive year.
05
04 06 07 08
$2.53
0
100
80
60
40
20
Chevron Year-End
Common Stock Price
Dollars per share
The company’s stock price
declined 20.7 percent in 2008.
The S&P 500 Index dropped
39 percent for the year.
0504 06 07 08
$73.97
0
30
24
18
12
6
Return on Capital Employed
Percent
Record net income helped boost
Chevron’s return on capital
employed to 26.6 percent. The
decline from 2004 to 2005
reflected a higher capital base
resulting from the Unocal
acquisition.
0504 06 07 08
26.6
4