Chevron 2008 Annual Report Download - page 104
Download and view the complete annual report
Please find page 104 of the 2008 Chevron annual report below. You can navigate through the pages in the report by either clicking on the pages listed below, or by using the keyword search tool below to find specific information within the annual report.-
 1
1 -
2
-
3
-
4
-
5
-
6
-
7
-
8
-
9
-
10
-
11
-
12
-
13
-
14
-
15
-
16
-
17
-
18
-
19
-
20
-
21
-
22
-
23
-
24
-
25
-
26
-
27
-
28
-
29
-
30
-
31
-
32
-
33
-
34
-
35
-
36
-
37
-
38
-
39
-
40
-
41
-
42
-
43
-
44
-
45
-
46
-
47
-
48
-
49
-
50
-
51
-
52
-
53
-
54
-
55
-
56
-
57
-
58
-
59
-
60
-
61
-
62
-
63
-
64
-
65
-
66
-
67
-
68
-
69
-
70
-
71
-
72
-
73
-
74
-
75
-
76
-
77
-
78
-
79
-
80
-
81
-
82
-
83
-
84
-
85
-
86
-
87
-
88
-
89
-
90
-
91
-
92
-
93
-
 94
94 -
 95
95 -
 96
96 -
 97
97 -
 98
98 -
 99
99 -
 100
100 -
 101
101 -
 102
102 -
 103
103 -
 104
104 -
 105
105 -
 106
106 -
 107
107 -
 108
108 -
 109
109 -
 110
110 -
 111
111 -
 112
112
 |
 |

102 Chevron Corporation 2008 Annual Report
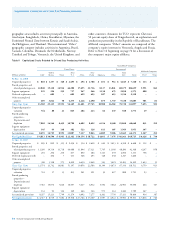
Supplemental Information on Oil and Gas Producing Activities
Net Proved Reserves of Natural Gas
Consolidated Companies
United States International
Gulf of Total Asia- Total Affiliated Companies
Billions of cubic feet Calif. Mexico Other U.S. Africa Pacific Indonesia Other Int’l. Total TCO Other
Reserves at Jan. 1, 20061 304 1,171 2,953 4,428 3,191 8,623 646 3,578 16,038 20,466 2,787 181
Changes attributable to:
Revisions 32 40 (102) (30) 34 400 38 39 511 481 26 –
Improved recovery 5 – – 5 3 – – 5 8 13 – –
Extensions and
discoveries – 111 157 268 11 510 – 10 531 799 – –
Purchases2 6 13 – 19 – 16 – – 16 35 – 54
Sales3 – – (1) (1) – – – (148) (148) (149) – –
Production (37) (241) (383) (661) (33) (629) (110) (302) (1,074) (1,735) (70) (4)
Reserves at Dec. 31, 20061 310 1,094 2,624 4,028 3,206 8,920 574 3,182 15,882 19,910 2,743 231
Changes attributable to:
Revisions 40 39 130 209 (141) 149 12 166 186 395 75 (2)
Improved recovery – – – – – – – 1 1 1 – –
Extensions and
discoveries – 40 46 86 11 392 – 29 432 518 – –
Purchases2 2 19 29 50 – 91 – – 91 141 – 211
Sales3 – (39) (37) (76) – – – – – (76) – (175)
Production (35) (210) (375) (620) (27) (725) (101) (279) (1,132) (1,752) (70) (10)
Reserves at Dec. 31, 20071 317 943 2,417 3,677 3,049 8,827 485 3,099 15,460 19,137 2,748 255
Changes attributable to:
Revisions 8 21 (57) (28) 60 961 107 66 1,194 1,166 498 632
Improved recovery – – – – – – – – – – – –
Extensions and
discoveries – 95 13 108 – 23 – 1 24 132 – –
Purchases – – 66 66 – 441 – – 441 507 – –
Sales3 – (27) (97) (124) – – – – – (124) – –
Production (32) (161) (356) (549) (53) (769) (117) (308) (1,247) (1,796) (71) (9)
Reserves at Dec. 31, 20081,4 293 871 1,986 3,150 3,056 9,483 475 2,858 15,872 19,022 3,175 878
Developed Reserves5
At Jan. 1, 2006 251 977 2,794 4,022 1,346 4,819 449 2,453 9,067 13,089 2,314 85
At Dec. 31, 2006 250 873 2,434 3,557 1,306 4,751 377 1,912 8,346 11,903 1,412 144
At Dec. 31, 2007 261 727 2,238 3,226 1,151 5,081 326 1,915 8,473 11,699 1,762 117
At Dec. 31, 2008 247 669 1,793 2,709 1,209 5,374 302 2,245 9,130 11,839 1,999 124
1 Includes year-end reserve quantities related to production-sharing contracts (PSC) (refer to page 32 for the definition of a PSC). PSC-related reserve quantities are 40 percent,
37 percent and 47 percent for consolidated companies for 2008, 2007 and 2006, respectively.
2 Includes reserves acquired through nonmonetary transactions.
3 Includes reserves disposed of through nonmonetary transactions.
4 Net reserve changes (excluding production) in 2008 consist of 1,936 billion cubic feet of developed reserves and (255) billion cubic feet of undeveloped reserves for consolidated
companies and 324 billion cubic feet of developed reserves and 806 billion cubic feet of undeveloped reserves for affiliated companies.
5 During 2008, the percentages of undeveloped reserves at December 31, 2007, transferred to developed reserves were 12 percent and 0 percent for consolidated companies and
affiliated companies, respectively.
Noteworthy amounts in the categories of natural gas
proved-reserve changes for 2006 through 2008 are dis-
cussed below:
Revisions In 2006, revisions accounted for a net increase
of 481 billion cubic feet (BCF) for consolidated companies
and 26 BCF for affiliates. For consolidated companies, net
increases of 511 BCF internationally were partially offset by
a 30 BCF downward revision in the United States. Drilling
and development activities added 337 BCF of reserves in
Thailand, while Kazakhstan added 200 BCF, largely due
to development activity. Trinidad and Tobago increased 185
BCF, attributable to improved reservoir performance and a
new contract for sales of natural gas. These additions were par-
tially offset by downward revisions of 224 BCF in the United
Kingdom and 130 BCF in Australia due to drilling results and
reservoir performance. U.S. “Other” had a downward revi-
sion of 102 BCF due to reservoir performance, which was
partially offset by upward revisions of 72 BCF in the Gulf of
Mexico and California related to reservoir performance and
development drilling. TCO had an upward revision of 26
BCF associated with additional development activity and
updated reservoir performance.
In 2007, revisions increased reserves for consolidated
companies by a net 395 BCF and increased reserves for affili-
Table V Reserve Quantity Information – Continued