Chevron 2008 Annual Report Download - page 101
Download and view the complete annual report
Please find page 101 of the 2008 Chevron annual report below. You can navigate through the pages in the report by either clicking on the pages listed below, or by using the keyword search tool below to find specific information within the annual report.-
 1
1 -
2
-
3
-
4
-
5
-
6
-
7
-
8
-
9
-
10
-
11
-
12
-
13
-
14
-
15
-
16
-
17
-
18
-
19
-
20
-
21
-
22
-
23
-
24
-
25
-
26
-
27
-
28
-
29
-
30
-
31
-
32
-
33
-
34
-
35
-
36
-
37
-
38
-
39
-
40
-
41
-
42
-
43
-
44
-
45
-
46
-
47
-
48
-
49
-
50
-
51
-
52
-
53
-
54
-
55
-
56
-
57
-
58
-
59
-
60
-
61
-
62
-
63
-
64
-
65
-
66
-
67
-
68
-
69
-
70
-
71
-
72
-
73
-
74
-
75
-
76
-
77
-
78
-
79
-
80
-
81
-
82
-
83
-
84
-
85
-
86
-
87
-
88
-
89
-
90
-
 91
91 -
 92
92 -
 93
93 -
 94
94 -
 95
95 -
 96
96 -
 97
97 -
 98
98 -
 99
99 -
 100
100 -
 101
101 -
 102
102 -
 103
103 -
 104
104 -
 105
105 -
 106
106 -
 107
107 -
 108
108 -
 109
109 -
 110
110 -
 111
111 -
112
 |
 |

Chevron Corporation 2008 Annual Report 99
During the year, the RAC is represented in meetings
with each of the company’s upstream business units to review
and discuss reserve changes recommended by the various
asset teams. Major changes are also reviewed with the com-
pany’s Strategy and Planning Committee and the Executive
Committee, whose members include the Chief Executive
Officer and the Chief Financial Officer. The company’s
annual reserve activity is also reviewed with the Board of
Directors. If major changes to reserves were to occur between
the annual reviews, those matters would also be discussed
with the Board.
RAC subteams also conduct in-depth reviews during
the year of many of the fields that have the largest proved
reserves quantities. These reviews include an examination of
the proved-reserve records and documentation of their align-
ment with the Corporate Reserves Manual.
Modernization of Oil and Gas Reporting In December
2008, the SEC issued its final rule, Modernization of Oil and
Gas Reporting (Release Nos. 33-8995; 34-59192; FR-78).
The disclosure requirements under the final rule will become
effective for the company in its Form 10-K filing for the year
ending December 31, 2009. The final rule changes a number
of oil and gas reserve estimation and disclosure requirements
under SEC Regulations S-K and S-X.
Among the principal changes in the final rule are
requirements to use a price based on a 12-month average for
reserve estimation and disclosure instead of a single end-of-
year price; expanding the definition of oil and gas producing
activities to include nontraditional sources such as bitumen
extracted from oil sands; permitting the use of new reli-
able technologies to establish reasonable certainty of proved
reserves; allowing optional disclosure of probable and pos-
sible reserves; modifying the definition of geographic area
for disclosure of reserve estimates and production; amending
disclosures of proved reserve quantities to include separate
disclosures of synthetic oil and gas; expanding proved,
undeveloped reserve disclosures (PUDs), including discus-
sion of PUDs five years old or more; and disclosure of the
qualifications of the chief technical person who oversees the
company’s overall reserves estimation process.
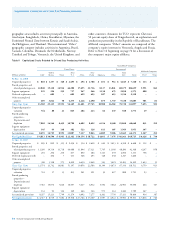
Reserve Quantities At December 31, 2008, oil-equivalent
reserves for the company’s consolidated operations were 7.9
billion barrels. (Refer to the term “Reserves” on page 32
for the definition of oil-equivalent reserves.) Approximately
25 percent of the total reserves were in the United States.
For the company’s interests in equity affiliates, oil-equivalent
reserves were 3.3 billion barrels, 82 percent of which were
associated with the company’s 50 percent ownership in TCO.
Aside from the Tengiz Field in the TCO affiliate, no
single property accounted for more than 5 percent of the
company’s total oil-equivalent proved reserves. About 20 other
individual properties in the company’s portfolio of assets
each contained between 1 percent and 5 percent of the com-
pany’s oil-equivalent proved reserves, which in the aggregate
accounted for approximately 40 percent of the company’s
total proved reserves. These properties were geographically
dispersed, located in the United States, South America, west-
ern Africa, the Middle East and the Asia-Pacific region.
In the United States, total oil-equivalent reserves at
year-end 2008 were 2.0 billion barrels. Of this amount, 43
percent, 22 percent and 35 percent were located in California,
the Gulf of Mexico and other U.S. areas, respectively.
In California, liquids reserves represented 94 percent of
the total, with most classified as heavy oil. Because of heavy
oil’s high viscosity and the need to employ enhanced recovery
methods, the producing operations are capital intensive in
nature. Most of the company’s heavy-oil fields in California
employ a continuous steamflooding process.
In the Gulf of Mexico region, liquids represented
approximately 66 percent of total oil-equivalent reserves.
Production operations are mostly offshore and, as a result, are
also capital intensive. Costs include investments in wells, pro-
duction platforms and other facilities, such as gathering lines
and storage facilities.
In other U.S. areas, the reserves were split about equally
between liquids and natural gas. For production of crude oil,
some fields utilize enhanced recovery methods, including
water-flood and CO2 injection.
The pattern of net reserve changes shown in the follow-
ing tables, for the three years ending December 31, 2008,
is not necessarily indicative of future trends. Apart from
acquisitions, the company’s ability to add proved reserves is
affected by, among other things, events and circumstances
that are outside the company’s control, such as delays in gov-
ernment permitting, partner approvals of development plans,
declines in oil and gas prices, OPEC constraints, geopolitical
uncertainties and civil unrest.
The upward revision in Thailand reflected additional
drilling and development activity during the year. These
upward revisions were partially offset by reductions in reser-
voir performance in Nigeria and the United Kingdom, which
decreased reserves by 43 million barrels and by 32 million
barrels, respectively. Most of the upward revision for affiliated
companies was related to a 60 million-barrel increase in TCO
as a result of improved reservoir performance.
In 2007, net revisions decreased reserves by 146 million
barrels for worldwide consolidated companies and increased
reserves by 103 million barrels for equity affiliates. For con-
solidated companies, the largest downward net revisions were
89 million barrels in Africa and 66 million barrels in Indonesia.
The company’s estimated net proved oil and natural gas
reserves and changes thereto for the years 2006, 2007 and
2008 are shown in the tables on pages 100 and 102.
Table V Reserve Quantity Information – Continued