Chevron 2008 Annual Report Download - page 63
Download and view the complete annual report
Please find page 63 of the 2008 Chevron annual report below. You can navigate through the pages in the report by either clicking on the pages listed below, or by using the keyword search tool below to find specific information within the annual report.-
 1
1 -
2
-
3
-
4
-
5
-
6
-
7
-
8
-
9
-
10
-
11
-
12
-
13
-
14
-
15
-
16
-
17
-
18
-
19
-
20
-
21
-
22
-
23
-
24
-
25
-
26
-
27
-
28
-
29
-
30
-
31
-
32
-
33
-
34
-
35
-
36
-
37
-
38
-
39
-
40
-
41
-
42
-
43
-
44
-
45
-
46
-
47
-
48
-
49
-
50
-
51
-
52
-
 53
53 -
 54
54 -
 55
55 -
 56
56 -
 57
57 -
 58
58 -
 59
59 -
 60
60 -
 61
61 -
 62
62 -
 63
63 -
 64
64 -
 65
65 -
 66
66 -
 67
67 -
 68
68 -
 69
69 -
 70
70 -
 71
71 -
 72
72 -
 73
73 -
74
-
75
-
76
-
77
-
78
-
79
-
80
-
81
-
82
-
83
-
84
-
85
-
86
-
87
-
88
-
89
-
90
-
91
-
92
-
93
-
94
-
95
-
96
-
97
-
98
-
99
-
100
-
101
-
102
-
103
-
104
-
105
-
106
-
107
-
108
-
109
-
110
-
111
-
112
 |
 |

Chevron Corporation 2008 Annual Report 61Chevron Corporation 2008 Annual Report 61
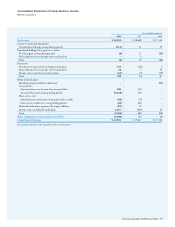
Consolidated Statement of Cash Flows
Millions of dollars
Year ended December 31
2008 2007 2006
Operating Activities
Net income $ 23,931 $ 18,688 $ 17,138
Adjustments
Depreciation, depletion and amortization 9,528 8,708 7,506
Dry hole expense 375 507 520
Distributions less than income from equity affiliates (440) (1,439) (979)
Net before-tax gains on asset retirements and sales (1,358) (2,315) (229)
Net foreign currency effects (355) 378 259
Deferred income tax provision 598 261 614
Net (increase) decrease in operating working capital (1,673) 685 1,044
Minority interest in net income 100 107 70
Increase in long-term receivables (161) (82) (900)
(Increase) decrease in other deferred charges (84) (530) 232
Cash contributions to employee pension plans (839) (317) (449)
Other 10 326 (503)
Net Cash Provided by Operating Activities 29,632 24,977 24,323
Investing Activities
Capital expenditures (19,666) (16,678) (13,813)
Repayment of loans by equity affiliates 179 21 463
Proceeds from asset sales 1,491 3,338 989
Net sales of marketable securities 483 185 142
Net sales (purchases) of other short-term investments 432 (799) –
Net Cash Used for Investing Activities (17,081) (13,933) (12,219)
Financing Activities
Net borrowings (payments) of short-term obligations 2,647 (345) (677)
Repayments of long-term debt and other financing obligations (965) (3,343) (2,224)
Proceeds from issuances of long-term debt – 650 –
Cash dividends – common stock (5,162) (4,791) (4,396)
Dividends paid to minority interests (99) (77) (60)
Net purchases of treasury shares (6,821) (6,389) (4,491)
Net Cash Used for Financing Activities (10,400) (14,295) (11,848)
Effect of Exchange Rate Changes
on Cash and Cash Equivalents (166) 120 194
Net Change in Cash and Cash Equivalents 1,985 (3,131) 450
Cash and Cash Equivalents at January 1 7,362 10,493 10,043
Cash and Cash Equivalents at December 31 $ 9,347 $ 7,362 $ 10,493
See accompanying Notes to the Consolidated Financial Statements.