Chevron 2008 Annual Report Download - page 46
Download and view the complete annual report
Please find page 46 of the 2008 Chevron annual report below. You can navigate through the pages in the report by either clicking on the pages listed below, or by using the keyword search tool below to find specific information within the annual report.-
 1
1 -
2
-
3
-
4
-
5
-
6
-
7
-
8
-
9
-
10
-
11
-
12
-
13
-
14
-
15
-
16
-
17
-
18
-
19
-
20
-
21
-
22
-
23
-
24
-
25
-
26
-
27
-
28
-
29
-
30
-
31
-
32
-
33
-
34
-
35
-
 36
36 -
 37
37 -
 38
38 -
 39
39 -
 40
40 -
 41
41 -
 42
42 -
 43
43 -
 44
44 -
 45
45 -
 46
46 -
 47
47 -
 48
48 -
 49
49 -
 50
50 -
 51
51 -
 52
52 -
 53
53 -
 54
54 -
 55
55 -
 56
56 -
57
-
58
-
59
-
60
-
61
-
62
-
63
-
64
-
65
-
66
-
67
-
68
-
69
-
70
-
71
-
72
-
73
-
74
-
75
-
76
-
77
-
78
-
79
-
80
-
81
-
82
-
83
-
84
-
85
-
86
-
87
-
88
-
89
-
90
-
91
-
92
-
93
-
94
-
95
-
96
-
97
-
98
-
99
-
100
-
101
-
102
-
103
-
104
-
105
-
106
-
107
-
108
-
109
-
110
-
111
-
112
 |
 |

Management’s Discussion and Analysis of
Financial Condition and Results of Operations
44 Chevron Corporation 2008 Annual Report
Worldwide downstream spending in 2009 is estimated
at $4.3 billion, with about $2.0 billion for projects in the
United States. Capital projects include upgrades to refiner-
ies in the United States and South Korea and construction
of a gas-to-liquids facility in support of associated upstream
projects.
Investments in chemicals, technology and other cor-
porate businesses in 2009 are budgeted at $1.0 billion.
Technology investments include projects related to uncon-
ventional hydrocarbon technologies, oil and gas reservoir
management, and gas-fired and renewable power generation.
Pension Obligations In 2008, the company’s pension
plan contributions were $839 million (including $577 million
to the U.S. plans). The company estimates contributions in
2009 will be approximately $800 million. Actual contribu-
tion amounts are dependent upon plan-investment results,
changes in pension obligations, regulatory requirements and
other economic factors. Additional funding may be required
if investment returns are insufficient to offset increases in plan
obligations. Refer also to the discussion of pension accounting
in “Critical Accounting Estimates and Assumptions,” begin-
ning on page 50.
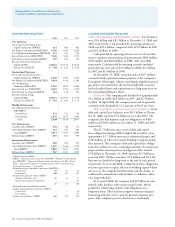
Financial Ratios
Financial Ratios
At December 31
2008 2007 2006
Current Ratio 1.1 1.2 1.3
Interest Coverage Ratio 166.9 69.2 53.5
Debt Ratio 9.3% 8.6% 12.5%
Current Ratio – current assets divided by current liabili-
ties. The current ratio in all periods was adversely affected by
the fact that Chevron’s inventories are valued on a Last-In,
First-Out basis. At year-end 2008, the book value of inventory
was lower than replacement costs, based on average acquisi-
tion costs during the year, by approximately $9 billion.
Interest Coverage Ratio
– income before income tax
expense, plus interest and
debt expense and amortiza-
tion of capitalized interest,
divided by before-tax interest
costs. The company’s inter-
est coverage ratio was higher
between 2007 and 2008 and
between 2006 and 2007,
primarily due to higher
before-tax income and lower
average debt balances in each
of the subsequent years.
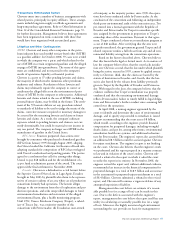
Debt Ratio – total debt
as a percentage of total debt
plus equity. The increase
between 2007 and 2008 was
primarily due to higher debt.
The decrease between 2006
and 2007 was due to lower
debt and higher stockholders’ equity balance.
Guarantees, Off-Balance-Sheet Arrangements and
Contractual Obligations, and Other Contingencies
Direct Guarantee
Millions of dollars Commitment Expiration by Period
2010– 2012– After
Total 2009 2011 2013 2013
Guarantee of non-
consolidated affiliate or
joint-venture obligation $ 613 $ – $ – $ 76 $ 537
The company’s guarantee of approximately $600 million
is associated with certain payments under a terminal-use
agreement entered into by a company affiliate. The terminal
is expected to be operational by 2012. Over the approximate
16-year term of the guarantee, the maximum guarantee
amount will be reduced as certain fees are paid by the affiliate.
Capital and Exploratory Expenditures
2008 2007 2006
Millions of dollars U.S. Int’l. Total U.S. Int’l. Total U.S. Int’l. Total
Upstream – Exploration and Production $ 5,516 $ 11,944 $ 17,460 $ 4,558 $ 10,980 $ 15,538 $ 4,123 $ 8,696 $ 12,819
Downstream – Refining, Marketing and
Transportation 2,182 2,023 4,205 1,576 1,867 3,443 1,176 1,999 3,175
Chemicals 407 78 485 218 53 271 146 54 200
All Other 618 7 625 768 6 774 403 14 417
Total $ 8,723 $ 14,052 $ 22,775 $ 7,120 $ 12,906 $ 20,026 $ 5,848 $ 10,763 $ 16,611
Total, Excluding Equity in Affiliates $ 8,241 $ 12,228 $ 20,469 $ 6,900 $ 10,790 $ 17,690 $ 5,642 $ 9,050 $ 14,692
0.0
100.0
20.0
60.0
80.0
40.0
0
50
40
30
20
10
024 D
Debt Ratio
Billions of dollars/Percent
Debt (left scale)
Stockholders’ Equity (left scale)
Ratio (right scale)
Chevron’s ratio of total debt to total
debt-plus-equity was 9.3 percent at
the end of 2008.
0504 06 07 08
$95.5