Chevron 2008 Annual Report Download - page 43
Download and view the complete annual report
Please find page 43 of the 2008 Chevron annual report below. You can navigate through the pages in the report by either clicking on the pages listed below, or by using the keyword search tool below to find specific information within the annual report.-
 1
1 -
2
-
3
-
4
-
5
-
6
-
7
-
8
-
9
-
10
-
11
-
12
-
13
-
14
-
15
-
16
-
17
-
18
-
19
-
20
-
21
-
22
-
23
-
24
-
25
-
26
-
27
-
28
-
29
-
30
-
31
-
32
-
 33
33 -
 34
34 -
 35
35 -
 36
36 -
 37
37 -
 38
38 -
 39
39 -
 40
40 -
 41
41 -
 42
42 -
 43
43 -
 44
44 -
 45
45 -
 46
46 -
 47
47 -
 48
48 -
 49
49 -
 50
50 -
 51
51 -
 52
52 -
 53
53 -
54
-
55
-
56
-
57
-
58
-
59
-
60
-
61
-
62
-
63
-
64
-
65
-
66
-
67
-
68
-
69
-
70
-
71
-
72
-
73
-
74
-
75
-
76
-
77
-
78
-
79
-
80
-
81
-
82
-
83
-
84
-
85
-
86
-
87
-
88
-
89
-
90
-
91
-
92
-
93
-
94
-
95
-
96
-
97
-
98
-
99
-
100
-
101
-
102
-
103
-
104
-
105
-
106
-
107
-
108
-
109
-
110
-
111
-
112
 |
 |

Chevron Corporation 2008 Annual Report 41
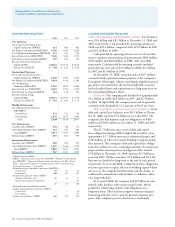
Millions of dollars 2008 2007 2006
Income from equity affiliates $ 5,366 $ 4,144 $ 4,255
Income from equity affiliates increased in 2008
from 2007 on improved upstream-related earnings at
Tengizchevroil (TCO) due to higher prices for crude oil.
Lower income from equity affiliates between 2006 and 2007
was mainly due to a decline in earnings from CPChem,
Dynegy (sold in May 2007) and downstream affiliates in
the Asia-Pacific area. Partially offsetting these declines were
improved results for TCO and income for a full year from
Petroboscan, which was converted from an operating service
agreement to a joint-stock company in October 2006. Refer
to Note 12, beginning on page 72, for a discussion of
Chevron’s investments in affiliated companies.
Millions of dollars 2008 2007 2006
Other income $ 2,681 $ 2,669 $ 971
Other income of $2.7 billion in 2008 included gains of
approximately $1.3 billion on asset sales. Other income of
$2.7 billion in 2007 included net gains of $1.7 billion from
asset sales and a loss of $245 million on the early redemption
of debt. Interest income was approximately $340 million in
2008 and $600 million in both 2007 and 2006. Foreign cur-
rency effects benefited other income by $355 million in 2008
while reducing other income by $352 million and $260 mil-
lion in 2007 and 2006, respectively.
Millions of dollars 2008 2007 2006
Purchased crude oil and products $ 171,397 $ 133,309 $ 128,151
Crude oil and product purchases in 2008 increased
$38.1 billion from 2007 due to higher prices for crude oil,
natural gas and refined products. Crude oil and product
purchases in 2007 increased more than $5 billion from 2006
due to these same factors.
Millions of dollars 2008 2007 2006
Operating, selling, general and
administrative expenses $ 26,551 $ 22,858 $ 19,717
Operating, selling, general and administrative expenses
in 2008 increased approximately $3.7 billion from 2007 pri-
marily due to $1.2 billion of higher costs for employee and
contract labor; $800 million of increased costs for materials,
services and equipment; $700 million of uninsured losses
associated with hurricanes in the Gulf of Mexico in 2008;
and an increase of about $300 million for environmental
remediation activities. Total expenses were about $3.1 billion
higher in 2007 than in 2006. Increases were recorded in a
number of categories, including $1.5 billion of higher costs
for employee and contract labor.
Millions of dollars 2008 2007 2006
Exploration expense $ 1,169 $ 1,323 $ 1,364
Exploration expenses in 2008 declined from 2007 due
mainly to lower amounts for well write-offs for operations
in the United States. Expenses in 2007 were essentially
unchanged from 2006.
Millions of dollars 2008 2007 2006
Depreciation, depletion and
amortization $ 9,528 $ 8,708 $ 7,506
Depreciation, depletion and amortization expenses
increased in 2008 from 2007 largely due to higher deprecia-
tion rates for certain crude oil and natural gas producing
fields, reflecting completion of higher-cost development proj-
ects and asset-retirement obligations. The increase between
2006 and 2007 reflects an increase in charges related to asset
write-downs and higher depreciation rates for certain crude
oil and natural gas producing fields worldwide.
Millions of dollars 2008 2007 2006
Taxes other than on income $ 21,303 $ 22,266 $ 20,883
Taxes other than on income decreased between 2007 and
2008 periods mainly due to lower import duties as a result of
the effects of the 2007 sales of the company’s Benelux refining
and marketing businesses and a decline in import volumes in
the United Kingdom. Taxes other than on income increased
between 2006 and 2007 due to higher import duties in the
company’s U.K. downstream operations in 2007.
Millions of dollars 2008 2007 2006
Interest and debt expense $ – $ 166 $ 451
Interest and debt expense decreased significantly in 2008
because all interest-related amounts were being capitalized.
Interest and debt expense in 2007 decreased from 2006
primarily due to lower average debt balances and higher
amounts of interest capitalized.
Millions of dollars 2008 2007 2006
Income tax expense $ 19,026 $ 13,479 $ 14,838
Effective income tax rates were 44 percent in 2008,
42 percent in 2007 and 46 percent in 2006. Rates were
higher between 2007 and 2008 primarily due to a greater
proportion of income earned in tax jurisdictions with higher
income tax rates. In addition, the 2007 period included a
relatively low effective tax rate on the sale of the company’s
investment in Dynegy common stock and the sale of down-
stream assets in Europe. Rates were lower in 2007 compared
with 2006 due mainly to the impact of nonrecurring items
in 2007 mentioned above and the absence of 2006 charges
related to a tax-law change that increased tax rates on
upstream operations in the U.K. North Sea and the settle-
ment of a tax claim in Venezuela. Refer also to the discussion
of income taxes in Note 16 beginning on page 76.