Chevron 2008 Annual Report Download - page 78
Download and view the complete annual report
Please find page 78 of the 2008 Chevron annual report below. You can navigate through the pages in the report by either clicking on the pages listed below, or by using the keyword search tool below to find specific information within the annual report.-
 1
1 -
2
-
3
-
4
-
5
-
6
-
7
-
8
-
9
-
10
-
11
-
12
-
13
-
14
-
15
-
16
-
17
-
18
-
19
-
20
-
21
-
22
-
23
-
24
-
25
-
26
-
27
-
28
-
29
-
30
-
31
-
32
-
33
-
34
-
35
-
36
-
37
-
38
-
39
-
40
-
41
-
42
-
43
-
44
-
45
-
46
-
47
-
48
-
49
-
50
-
51
-
52
-
53
-
54
-
55
-
56
-
57
-
58
-
59
-
60
-
61
-
62
-
63
-
64
-
65
-
66
-
67
-
 68
68 -
 69
69 -
 70
70 -
 71
71 -
 72
72 -
 73
73 -
 74
74 -
 75
75 -
 76
76 -
 77
77 -
 78
78 -
 79
79 -
 80
80 -
 81
81 -
 82
82 -
 83
83 -
 84
84 -
 85
85 -
 86
86 -
 87
87 -
 88
88 -
89
-
90
-
91
-
92
-
93
-
94
-
95
-
96
-
97
-
98
-
99
-
100
-
101
-
102
-
103
-
104
-
105
-
106
-
107
-
108
-
109
-
110
-
111
-
112
 |
 |

76 Chevron Corporation 2008 Annual Report
total of $8,400. Chevron submitted a rebuttal to the revised
report, and Chevron will continue a vigorous defense of any
attempted imposition of liability.
Management does not believe an estimate of a reason-
ably possible loss (or a range of loss) can be made in this
case. Due to the defects associated with the engineer’s report,
management does not believe the report itself has any utility
in calculating a reasonably possible loss (or a range of loss).
Moreover, the highly uncertain legal environment surround-
ing the case provides no basis for management to estimate a
reasonably possible loss (or a range of loss).
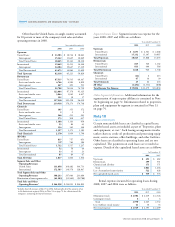
Note 16
Taxes
Income Taxes
Year ended December 31
2008 2007 2006
Taxes on income
U.S. Federal
Current $ 2,879 $ 1,446 $ 2,828
Deferred 274 225 200
State and local 669 338 581
Total United States 3,822 2,009 3,609
International
Current 15,021 11,416 11,030
Deferred 183 54 199
Total International 15,204 11,470 11,229
Total taxes on income $ 19,026 $ 13,479 $ 14,838
In 2008, before-tax income for U.S. operations, includ-
ing related corporate and other charges, was $10,682,
compared with before-tax income of $7,794 and $9,131 in
2007 and 2006, respectively. For international operations,
before-tax income was $32,275, $24,373 and $22,845 in
2008, 2007 and 2006, respectively. U.S. federal income tax
expense was reduced by $198, $132 and $116 in 2008, 2007
and 2006, respectively, for business tax credits.
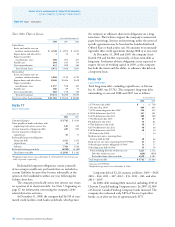
The reconciliation between the U.S. statutory federal
income tax rate and the company’s effective income tax rate is
explained in the table below:
Year ended December 31
2008 2007 2006
U.S. statutory federal income tax rate 35.0% 35.0% 35.0%
Effect of income taxes from inter-
national operations at rates different
from the U.S. statutory rate 10.2 8.3 10.3
State and local taxes on income, net
of U.S. federal income tax benefit 1.0 0.8 1.0
Prior-year tax adjustments (0.1) 0.3 0.9
Tax credits (0.5) (0.4) (0.4)
Effects of enacted changes in tax laws (0.6) (0.3) 0.3
Other (0.7) (1.8) (0.7)
Effective tax rate 44.3% 41.9% 46.4%
The company’s effective tax rate increased from 41.9 per-
cent in 2007 to 44.3 percent in 2008. The increase in the
“Effect of income taxes from international operations at rates
different from the U.S. statutory rate” from 8.3 percent in
2007 to 10.2 percent in 2008 was mainly due to a greater
proportion of income being earned in 2008 in tax jurisdic-
tions with higher tax rates. In addition, the 2007 period
included a relatively low tax rate on the sale of downstream
assets in Europe. The change in “Other” from a negative 1.8
percent to a negative 0.7 percent primarily related to a lower
effective tax rate on the sale of the company’s investment in
Dynegy common stock in 2007.
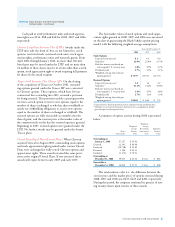
The company records its deferred taxes on a tax-
jurisdiction basis and classifies those net amounts as current
or noncurrent based on the balance sheet classification of the
related assets or liabilities. The reported deferred tax balances
are composed of the following:
At December 31
2008 2007
Deferred tax liabilities
Properties, plant and equipment $ 18,271 $ 17,310
Investments and other 2,225 1,837
Total deferred tax liabilities 20,496 19,147
Deferred tax assets
Abandonment/environmental reserves (4,338) (3,587)
Employee benefits (3,488) (2,148)
Tax loss carryforwards (1,139) (1,603)
Deferred credits (3,933) (1,689)
Foreign tax credits (4,784) (3,138)
Inventory (260) (608)
Other accrued liabilities (445) (477)
Miscellaneous (1,732) (1,528)
Total deferred tax assets (20,119) (14,778)
Deferred tax assets valuation allowance 7,535 5,949
Total deferred taxes, net $ 7,912 $ 10,318
Deferred tax liabilities at the end of 2008 increased by
approximately $1,300 from year-end 2007. The increase was
primarily related to increased temporary differences for prop-
erties, plant and equipment.
Deferred tax assets increased by approximately $5,300
in 2008. The increase related primarily to deferred credits
recorded for future tax benefits earned from a new field in
Africa ($2,200); increased deferred tax benefits for pension-
related obligations ($1,300); and additional foreign tax
credits arising from earnings in high-tax-rate international
jurisdictions ($1,600), which were substantially offset by val-
uation allowances.
The overall valuation allowance relates to foreign tax
credit carry forwards, tax loss carryforwards and temporary
differences for which no benefit is expected to be realized.
Tax loss carry forwards exist in many international jurisdic-
tions. Whereas some of these tax loss carry forwards do not
have an expiration date, others expire at various times from
Note 15 Litigation – Continued
Notes to the Consolidated Financial Statements
Millions of dollars, except per-share amounts