Chevron 2008 Annual Report Download - page 44
Download and view the complete annual report
Please find page 44 of the 2008 Chevron annual report below. You can navigate through the pages in the report by either clicking on the pages listed below, or by using the keyword search tool below to find specific information within the annual report.-
 1
1 -
2
-
3
-
4
-
5
-
6
-
7
-
8
-
9
-
10
-
11
-
12
-
13
-
14
-
15
-
16
-
17
-
18
-
19
-
20
-
21
-
22
-
23
-
24
-
25
-
26
-
27
-
28
-
29
-
30
-
31
-
32
-
33
-
 34
34 -
 35
35 -
 36
36 -
 37
37 -
 38
38 -
 39
39 -
 40
40 -
 41
41 -
 42
42 -
 43
43 -
 44
44 -
 45
45 -
 46
46 -
 47
47 -
 48
48 -
 49
49 -
 50
50 -
 51
51 -
 52
52 -
 53
53 -
 54
54 -
55
-
56
-
57
-
58
-
59
-
60
-
61
-
62
-
63
-
64
-
65
-
66
-
67
-
68
-
69
-
70
-
71
-
72
-
73
-
74
-
75
-
76
-
77
-
78
-
79
-
80
-
81
-
82
-
83
-
84
-
85
-
86
-
87
-
88
-
89
-
90
-
91
-
92
-
93
-
94
-
95
-
96
-
97
-
98
-
99
-
100
-
101
-
102
-
103
-
104
-
105
-
106
-
107
-
108
-
109
-
110
-
111
-
112
 |
 |

Management’s Discussion and Analysis of
Financial Condition and Results of Operations
42 Chevron Corporation 2008 Annual Report
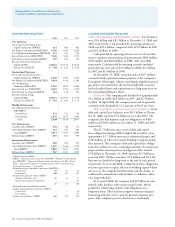
Selected Operating Data1,2
2008 2007 2006
U.S. Upstream
Net Crude Oil and Natural Gas
Liquids Production (MBPD) 421 460 462
Net Natural Gas Production (MMCFPD)3 1,501 1,699 1,810
Net Oil-Equivalent Production (MBOEPD) 671 743 763
Sales of Natural Gas (MMCFPD) 7,226 7,624 7,051
Sales of Natural Gas Liquids (MBPD) 159 160 124
Revenues From Net Production
Liquids ($/Bbl) $ 88.43 $ 63.16 $ 56.66
Natural Gas ($/MCF) $ 7.90 $ 6.12 $ 6.29
International Upstream
Net Crude Oil and Natural Gas
Liquids Production (MBPD) 1,228 1,296 1,270
Net Natural Gas Production (MMCFPD)3 3,624 3,320 3,146
Net Oil-Equivalent
Production (MBOEPD)4 1,859 1,876 1,904
Sales Natural Gas (MMCFPD) 4,215 3,792 3,478
Sales Natural Gas Liquids (MBPD) 114 118 102
Revenues From Liftings
Liquids ($/Bbl) $ 86.51 $ 65.01 $ 57.65
Natural Gas ($/MCF) $ 5.19 $ 3.90 $ 3.73
Worldwide Upstream
Net Oil-Equivalent Production
(MBOEPD)3,4
United States 671 743 763
International 1,859 1,876 1,904
Total 2,530 2,619 2,667
U.S. Downstream
Gasoline Sales (MBPD)5 692 728 712
Other Refined-Product Sales (MBPD) 721 729 782
Total (MBPD)6 1,413 1,457 1,494
Refinery Input (MBPD) 891 812 939
International Downstream
Gasoline Sales (MBPD)5 589 581 595
Other Refined-Product Sales (MBPD) 1,427 1,446 1,532
Total (MBPD)6, 7 2,016 2,027 2,127
Refinery Input (MBPD) 967 1,021 1,050
1 Includes interest in affiliates.
2 MBPD = Thousands of barrels per day; MMCFPD = Millions of cubic feet per
day; MBOEPD = Thousands of barrels of oil-equivalent per day; Bbl = Barrel;
MCF = Thousands of cubic feet. Oil-equivalent gas (OEG) conversion ratio is
6,000 cubic feet of gas = 1 barrel of oil.
3 Includes natural gas consumed in operations (MMCFPD):
United States 70 65 56
International 450 433 419
4 Includes other produced volumes (MBPD):
Athabasca Oil Sands – Net 27 27 27
Boscan Operating Service Agreement – – 82
27 27 109
5 Includes branded and unbranded gasoline.
6 Includes volumes for buy/sell contracts (MBPD):
United States – – 26
International – – 24
7 Includes sales of affiliates (MBPD): 512 492 492
Liquidity and Capital Resources
Cash, cash equivalents and marketable securities Total balances
were $9.6 billion and $8.1 billion at December 31, 2008 and
2007, respectively. Cash provided by operating activities in
2008 was $29.6 billion, compared with $25.0 billion in 2007
and $24.3 billion in 2006.
Cash provided by operating activities was net of contribu-
tions to employee pension plans of approximately $800 million,
$300 million and $400 million in 2008, 2007 and 2006,
respectively. Cash provided by investing activities included
proceeds from asset sales of $1.5 billion in 2008, $3.3 billion
in 2007 and $1.0 billion in 2006.
At December 31, 2008, restricted cash of $367 million
associated with capital-investment projects at the company’s
Pascagoula, Mississippi, refinery and Angola liquefied natural
gas project was invested in short-term marketable securities
and reclassified from cash equivalents to a long-term asset on
the Consolidated Balance Sheet.
Dividends The company paid dividends of approximately
$5.2 billion in 2008, $4.8 billion in 2007 and $4.4 billion
in 2006. In April 2008, the company increased its quarterly
common stock dividend by 12.1 percent to $0.65 per share.
Debt, capital lease and minority interest obligations Total
debt and capital lease balances were $8.9 billion at Decem-
ber 31, 2008, up from $7.2 billion at year-end 2007. The
company also had minority interest obligations of $469
million and $204 million at December 31, 2008 and 2007,
respectively.
The $1.7 billion increase in total debt and capital
lease obligations during 2008 included the net effect of an
approximate $2.7 billion increase in commercial paper and
$749 million of Chevron Canada Funding Company bonds
that matured. The company’s debt and capital lease obliga-
tions due within one year, consisting primarily of commercial
paper and the current portion of long-term debt, totaled
$7.8 billion at December 31, 2008, up from $5.5 billion at
year-end 2007. Of these amounts, $5.0 billion and $4.4 bil-
lion were reclassified to long-term at the end of each period,
respectively. At year-end 2008, settlement of these obligations
was not expected to require the use of working capital within
one year, as the company had the intent and the ability, as
evidenced by committed credit facilities, to refinance them
on a long-term basis.
At year-end 2008, the company had $5 billion in com-
mitted credit facilities with various major banks, which
permit the refinancing of short-term obligations on a
long-term basis. These facilities support commercial-paper
borrowing and also can be used for general corporate pur-
poses. The company’s practice has been to continually