Chevron 2008 Annual Report Download - page 42
Download and view the complete annual report
Please find page 42 of the 2008 Chevron annual report below. You can navigate through the pages in the report by either clicking on the pages listed below, or by using the keyword search tool below to find specific information within the annual report.-
 1
1 -
2
-
3
-
4
-
5
-
6
-
7
-
8
-
9
-
10
-
11
-
12
-
13
-
14
-
15
-
16
-
17
-
18
-
19
-
20
-
21
-
22
-
23
-
24
-
25
-
26
-
27
-
28
-
29
-
30
-
31
-
 32
32 -
 33
33 -
 34
34 -
 35
35 -
 36
36 -
 37
37 -
 38
38 -
 39
39 -
 40
40 -
 41
41 -
 42
42 -
 43
43 -
 44
44 -
 45
45 -
 46
46 -
 47
47 -
 48
48 -
 49
49 -
 50
50 -
 51
51 -
 52
52 -
53
-
54
-
55
-
56
-
57
-
58
-
59
-
60
-
61
-
62
-
63
-
64
-
65
-
66
-
67
-
68
-
69
-
70
-
71
-
72
-
73
-
74
-
75
-
76
-
77
-
78
-
79
-
80
-
81
-
82
-
83
-
84
-
85
-
86
-
87
-
88
-
89
-
90
-
91
-
92
-
93
-
94
-
95
-
96
-
97
-
98
-
99
-
100
-
101
-
102
-
103
-
104
-
105
-
106
-
107
-
108
-
109
-
110
-
111
-
112
 |
 |

Management’s Discussion and Analysis of
Financial Condition and Results of Operations
40 Chevron Corporation 2008 Annual Report
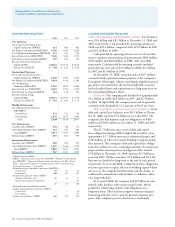
Refined-product sales
volumes were 2.02 million
barrels per day in 2008,
about 1 percent lower
than 2007 due mainly to
reduced sales of gas oil and
fuel oil. Refined product
sales volumes were 2.03
million barrels per day in
2007, about 5 percent lower
than 2006. The decline in
2007 was largely due to the
impact of asset sales and
the accounting-standard
change for buy/sell contracts.
Excluding the accounting
change, sales decreased about
4 percent.
Refer to the “Selected
Operating Data” table, on
page 42, for a three-year
comparative of sales volumes
of gasoline and other refined
products and refinery-input
volumes. Refer also to Note 14, “Accounting for Buy/Sell
Contracts,” on page 74 for a discussion of the accounting
for purchase-and-sale contracts with the same counterparty.
Chemicals
Millions of dollars 2008 2007 2006
Income* $ 182 $ 396 $ 539
*Includes Foreign Currency Effects: $ (18) $ (3) $ (8)
The chemicals segment includes the company’s Oronite
subsidiary and the 50 percent-owned Chevron Phillips
Chemical Company LLC (CPChem). In 2008, earnings were
$182 million, compared with $396 million and $539 million
in 2007 and 2006, respectively. Earnings declined in 2008
due to lower sales volumes of commodity chemicals by
CPChem. Higher expenses for planned maintenance activi-
ties also contributed to the earnings decline. Earnings also
declined for the company’s Oronite subsidiary due to lower
volumes and higher operating expenses. In 2007, earnings of
$396 million decreased $143 million from 2006 due to the
impact of lower margins on the sale of commodity chemicals
by CPChem that were only partially offset by improved mar-
gins on Oronite’s sales of additives for lubricants and fuel.
All Other
Millions of dollars 2008 2007 2006
Net Charges* $ (1,390) $ (26) $ (516)
*Includes Foreign Currency Effects: $ (186) $ 6 $ 62
All Other includes
mining operations, power
generation businesses,
worldwide cash manage-
ment and debt financing
activities, corporate admin-
istrative functions,
insurance operations, real
estate activities, alternative
fuels and technology com-
panies, and the company’s
interest in Dynegy prior to
its sale in May 2007.
Net charges in 2008
increased $1.4 billion from
2007. Results in 2007
included a $680 million gain
on the sale of the company’s
investment in Dynegy com-
mon stock and a loss of
approximately $175 million
associated with the early redemption of Texaco Capital Inc.
bonds. Results in 2008 included net unfavorable corporate tax
items and increased costs of environmental remediation for
sites that previously had been closed or sold. Foreign exchange
effects also contributed to the increase in net charges between
years. Net charges of $26 million in 2007 decreased $490 mil-
lion from 2006 due mainly to the Dynegy-related gain in 2007.
Consolidated Statement of Income
Comparative amounts for certain income statement catego-
ries are shown below:
Millions of dollars 2008 2007 2006
Sales and other operating revenues $ 264,958 $ 214,091 $ 204,892
Sales and other operating revenues increased in the com-
parative periods due mainly to higher prices for crude oil,
natural gas and refined products.
0
600
200
100
300
400
500
Worldwide Chemicals
Earnings*
Millions of dollars
Chemicals earnings decreased
about 54 percent from 2007 due
to lower sales volumes of commodity
chemicals and higher expenses.
*Includes equity in affiliates
0504 06 07 08
$182
0
2500
2000
1500
1000
500
020 I
Re
International Gasoline &
Other Rened-Product
Sales*
Thousands of barrels per day
Sales volumes of refined products
were down 1 percent from 2007.
*Includes equity in affiliates
Gasoline
Jet Fuel
Gas Oils & Kerosene
Residual Fuel Oil
Other
0504 06 07 08
2,016