Chevron 2008 Annual Report Download - page 96
Download and view the complete annual report
Please find page 96 of the 2008 Chevron annual report below. You can navigate through the pages in the report by either clicking on the pages listed below, or by using the keyword search tool below to find specific information within the annual report.-
 1
1 -
2
-
3
-
4
-
5
-
6
-
7
-
8
-
9
-
10
-
11
-
12
-
13
-
14
-
15
-
16
-
17
-
18
-
19
-
20
-
21
-
22
-
23
-
24
-
25
-
26
-
27
-
28
-
29
-
30
-
31
-
32
-
33
-
34
-
35
-
36
-
37
-
38
-
39
-
40
-
41
-
42
-
43
-
44
-
45
-
46
-
47
-
48
-
49
-
50
-
51
-
52
-
53
-
54
-
55
-
56
-
57
-
58
-
59
-
60
-
61
-
62
-
63
-
64
-
65
-
66
-
67
-
68
-
69
-
70
-
71
-
72
-
73
-
74
-
75
-
76
-
77
-
78
-
79
-
80
-
81
-
82
-
83
-
84
-
85
-
 86
86 -
 87
87 -
 88
88 -
 89
89 -
 90
90 -
 91
91 -
 92
92 -
 93
93 -
 94
94 -
 95
95 -
 96
96 -
 97
97 -
 98
98 -
 99
99 -
 100
100 -
 101
101 -
 102
102 -
 103
103 -
 104
104 -
 105
105 -
 106
106 -
107
-
108
-
109
-
110
-
111
-
112
 |
 |

94 Chevron Corporation 2008 Annual Report
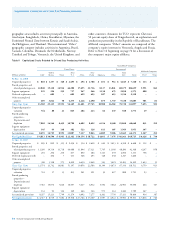
Supplemental Information on Oil and Gas Producing Activities
Table II Capitalized Costs Related to Oil and Gas Producing Activities
Consolidated Companies
United States International
Gulf of Total Asia- Total Affiliated Companies
Millions of dollars Calif. Mexico Other U.S. Africa Pacific Indonesia Other Int’l. Total TCO Other
At Dec. 31, 2008
Unproved properties $ 810 $ 1,357 $ 328 $ 2,495 $ 294 $ 2,788 $ 651 $ 912 $ 4,645 $ 7,140 $ 113 $ –
Proved properties and
related producing assets 12,048 19,318 14,914 46,280 17,495 21,726 8,117 13,041 60,379 106,659 5,991 841
Support equipment 239 226 252 717 967 266 1,150 475 2,858 3,575 888 –
Deferred exploratory wells – 602 – 602 499 495 107 415 1,516 2,118 – –
Other uncompleted
projects 405 3,812 58 4,275 4,226 2,490 875 1,739 9,330 13,605 501 81
Gross Cap. Costs 13,502 25,315 15,552 54,369 23,481 27,765 10,900 16,582 78,728 133,097 7,493 922
Unproved properties
valuation 744 80 21 845 202 223 64 439 928 1,773 29 –
Proved producing
properties –
Depreciation and
depletion 7,802 14,546 8,432 30,780 6,602 8,692 6,214 8,360 29,868 60,648 831 212
Support equipment
depreciation 145 99 138 382 523 128 611 307 1,569 1,951 307 –
Accumulated provisions 8,691 14,725 8,591 32,007 7,327 9,043 6,889 9,106 32,365 64,372 1,167 212
Net Capitalized Costs $ 4,811 $ 10,590 $ 6,961 $ 22,362 $ 16,154 $ 18,722 $ 4,011 $ 7,476 $ 46,363 $ 68,725 $ 6,326 $ 710
At Dec. 31, 2007
Unproved properties $ 805 $ 892 $ 353 $ 2,050 $ 314 $ 2,639 $ 630 $ 1,015 $ 4,598 $ 6,648 $ 112 $ –
Proved properties and
related producing assets 11,260 19,110 13,718 44,088 11,894 17,321 7,705 11,360 48,280 92,368 4,247 858
Support equipment 201 206 230 637 850 284 1,123 439 2,696 3,333 758 –
Deferred exploratory wells – 406 7 413 368 293 148 438 1,247 1,660 – –
Other uncompleted
projects 308 3,128 573 4,009 6,430 2,049 593 1,421 10,493 14,502 1,633 55
Gross Cap. Costs 12,574 23,742 14,881 51,197 19,856 22,586 10,199 14,673 67,314 118,511 6,750 913
Unproved properties
valuation 741 57 35 833 201 221 39 427 888 1,721 23 –
Proved producing
properties –
Depreciation and
depletion 7,383 15,074 7,640 30,097 5,427 6,912 5,592 7,062 24,993 55,090 644 167
Support equipment
depreciation 133 92 124 349 464 144 571 261 1,440 1,789 267 –
Accumulated provisions 8,257 15,223 7,799 31,279 6,092 7,277 6,202 7,750 27,321 58,600 934 167
Net Capitalized Costs $ 4,317 $ 8,519 $ 7,082 $ 19,918 $ 13,764 $ 15,309 $ 3,997 $ 6,923 $ 39,993 $ 59,911 $ 5,816 $ 746
geographic area includes activities principally in Australia,
Azerbaijan, Bangladesh, China, Kazakhstan, Myanmar, the
Partitioned Neutral Zone between Kuwait and Saudi Arabia,
the Philippines, and Thailand. The international “Other”
geographic category includes activities in Argentina, Brazil,
Canada, Colombia, Denmark, the Netherlands, Norway,
Trinidad and Tobago, Venezuela, the United Kingdom, and
other countries. Amounts for TCO represent Chevron’s
50 percent equity share of Tengizchevroil, an exploration and
production partnership in the Republic of Kazakhstan. The
affiliated companies “Other” amounts are composed of the
company’s equity interests in Venezuela, Angola and Russia.
Refer to Note 12 beginning on page 72 for a discussion of
the company’s major equity affiliates.