Activision 2008 Annual Report Download - page 73
Download and view the complete annual report
Please find page 73 of the 2008 Activision annual report below. You can navigate through the pages in the report by either clicking on the pages listed below, or by using the keyword search tool below to find specific information within the annual report.-
 1
1 -
2
-
3
-
4
-
5
-
6
-
7
-
8
-
9
-
10
-
11
-
12
-
13
-
14
-
15
-
16
-
17
-
18
-
19
-
20
-
21
-
22
-
23
-
24
-
25
-
26
-
27
-
28
-
29
-
30
-
31
-
32
-
33
-
34
-
35
-
36
-
37
-
38
-
39
-
40
-
41
-
42
-
43
-
44
-
45
-
46
-
47
-
48
-
49
-
50
-
51
-
52
-
53
-
54
-
55
-
56
-
57
-
58
-
59
-
60
-
61
-
62
-
 63
63 -
 64
64 -
 65
65 -
 66
66 -
 67
67 -
 68
68 -
 69
69 -
 70
70 -
 71
71 -
 72
72 -
 73
73 -
 74
74 -
 75
75 -
 76
76 -
 77
77 -
 78
78 -
 79
79 -
 80
80 -
 81
81 -
 82
82 -
 83
83 -
84
-
85
-
86
-
87
-
88
-
89
-
90
-
91
-
92
-
93
-
94
-
95
-
96
-
97
-
98
-
99
-
100
-
101
-
102
-
103
-
104
-
105
-
106
-
107
-
108
-
109
-
110
-
111
-
112
-
113
-
114
-
115
-
116
 |
 |

59
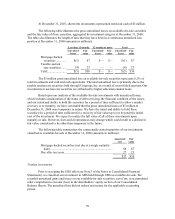
At December 31, 2007, short-term investments represented restricted cash of $3 million.
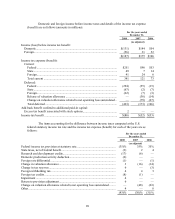
The following table illustrates the gross unrealized losses on available-for-sale securities
and the fair value of those securities, aggregated by investment category at December 31, 2008.
The table also illustrates the length of time that they have been in a continuous unrealized loss
position at December 31, 2008 (amounts in millions):
Less than 12 months 12 months or more Total
Unrealized
losses Fair
value Unrealized
losses Fair
value Unrealized
losses Fair
value
Mortgage-backed
securities .............
.
$(1) $7 $— $— $(1) $7
Taxable auction
rate securities ......
.
(4) 23 — — (4) 23
Total........................
.
$(5) $30 $— $— $(5) $30
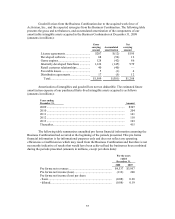
The $5 million gross unrealized loss on available-for-sale securities represents 0.2% of
total investments and cash and cash equivalents. The total unrealized loss is primarily due to the
taxable auction rate securities held through Citigroup, Inc. as a result of recent failed auctions. Our
investments in auction rate securities are all backed by higher education student loans.
Based upon our analysis of the available-for-sale investments with unrealized losses,
which includes consideration of the status of debt servicing, the financial condition of the issuer,
and our intent and ability to hold the securities for a period of time sufficient to allow a market
recovery or to maturity, we have concluded that the gross unrealized losses of $5 million at
December 31, 2008 were temporary in nature. We have the intent and ability to hold these
securities for a period of time sufficient for a recovery of fair value up to (or beyond) the initial
cost of the investment. We expect to realize the full value of all of these investments upon
maturity or sale. However, facts and circumstances may change which could result in a decline in
fair value considered to be other-than-temporary in the future.
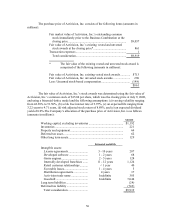
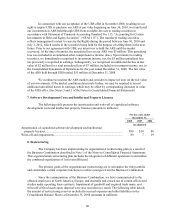
The following table summarizes the contractually stated maturities of our investments
classified as available-for-sale at December 31, 2008 (amounts in millions):
Amortized
cost Fair
value
Mortgage-backed securities (not due at a single maturity
date) ................................................................................
.
$8 $7
Due after ten years..............................................................
.
27 23
$35 $30
Trading Investments
Prior to accepting the UBS offer (see Note 3 of the Notes to Consolidated Financial
Statements), we classified our investment in ARS held through UBS as available-for-sale. We
recorded unrealized gains and losses on our available-for-sale securities, net of tax, in accumulated
other comprehensive income (loss) in the shareholders’ equity section of our Consolidated
Balance Sheets. The unrealized loss did not reduce net income for the applicable accounting
period.