Activision 2008 Annual Report Download - page 34
Download and view the complete annual report
Please find page 34 of the 2008 Activision annual report below. You can navigate through the pages in the report by either clicking on the pages listed below, or by using the keyword search tool below to find specific information within the annual report.-
 1
1 -
2
-
3
-
4
-
5
-
6
-
7
-
8
-
9
-
10
-
11
-
12
-
13
-
14
-
15
-
16
-
17
-
18
-
19
-
20
-
21
-
22
-
23
-
 24
24 -
 25
25 -
 26
26 -
 27
27 -
 28
28 -
 29
29 -
 30
30 -
 31
31 -
 32
32 -
 33
33 -
 34
34 -
 35
35 -
 36
36 -
 37
37 -
 38
38 -
 39
39 -
 40
40 -
 41
41 -
 42
42 -
 43
43 -
 44
44 -
45
-
46
-
47
-
48
-
49
-
50
-
51
-
52
-
53
-
54
-
55
-
56
-
57
-
58
-
59
-
60
-
61
-
62
-
63
-
64
-
65
-
66
-
67
-
68
-
69
-
70
-
71
-
72
-
73
-
74
-
75
-
76
-
77
-
78
-
79
-
80
-
81
-
82
-
83
-
84
-
85
-
86
-
87
-
88
-
89
-
90
-
91
-
92
-
93
-
94
-
95
-
96
-
97
-
98
-
99
-
100
-
101
-
102
-
103
-
104
-
105
-
106
-
107
-
108
-
109
-
110
-
111
-
112
-
113
-
114
-
115
-
116
 |
 |

20
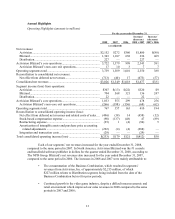
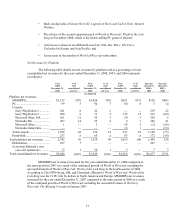
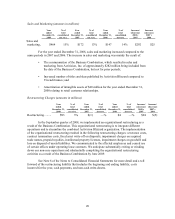
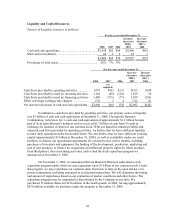
Sales and Marketing (amounts in millions)
Year
ended
December 31,
2008
% of
total
consolidated
net revs.
Year
ended
December 31,
2007
% of
total
consolidated
net revs.
Year
ended
December 31,
2006
% of
total
consolidated
net revs.
Increase/
(decrease)
2008 v
2007
Increase/
(decrease)
2007 v
2006
Sales and
marketing.
.
$464 15% $172 13% $147 14% $292 $25
For the year ended December 31, 2008, sales and marketing increased compared to the
same periods in 2007 and 2006. The increase in sales and marketing was mainly the result of:
• The consummation of the Business Combination, which resulted in sales and
marketing from Activision, Inc. of approximately $282 million being included from
the date of the Business Combination, but not for prior periods;
• Increased number of titles and skus published by Activision Blizzard compared to
Vivendi Games; and
• Amortization of intangible assets of $40 million for the year ended December 31,
2008 relating to retail customer relationships.
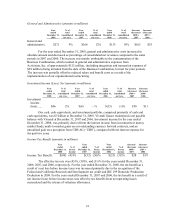
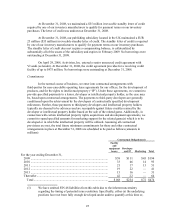
Restructuring Charges (amounts in millions)
Year
ended
December 31,
2008
% of
total
consolidated
net revs.
Year
ended
December 31,
2007
% of
total
consolidated
net revs.
Year
ended
December 31,
2006
% of
total
consolidated
net revs.
Increase/
(decrease)
2008 v
2007
Increase/
(decrease)
2007 v
2006
Restructuring ......... $93 3% $(1) —% $4 —% $94 $(5)
In the September quarter of 2008, we implemented an organizational restructuring as a
result of the Business Combination. This organizational restructuring is to integrate different
operations and to streamline the combined Activision Blizzard organization. The implementation
of the organizational restructuring resulted in the following restructuring charges: severance costs,
contract termination costs, fixed asset write-off on disposals, impairment charges on acquired
trade names, prepaid royalties, intellectual property licenses, impairment charges on goodwill and
loss on disposal of assets/liabilities. We communicated to the affected employees and ceased use
of certain offices under operating lease contracts. We anticipate substantially exiting or winding
down our non-core operations and substantially completing the organizational restructuring
activities as a result of the Business Combination by June 2009.
See Note 8 of the Notes to Consolidated Financial Statements for more detail and a roll
forward of the restructuring liability that includes the beginning and ending liability, costs
incurred for the year, cash payments, and non-cash write-downs.