Activision 2008 Annual Report Download - page 30
Download and view the complete annual report
Please find page 30 of the 2008 Activision annual report below. You can navigate through the pages in the report by either clicking on the pages listed below, or by using the keyword search tool below to find specific information within the annual report.-
 1
1 -
2
-
3
-
4
-
5
-
6
-
7
-
8
-
9
-
10
-
11
-
12
-
13
-
14
-
15
-
16
-
17
-
18
-
19
-
 20
20 -
 21
21 -
 22
22 -
 23
23 -
 24
24 -
 25
25 -
 26
26 -
 27
27 -
 28
28 -
 29
29 -
 30
30 -
 31
31 -
 32
32 -
 33
33 -
 34
34 -
 35
35 -
 36
36 -
 37
37 -
 38
38 -
 39
39 -
 40
40 -
41
-
42
-
43
-
44
-
45
-
46
-
47
-
48
-
49
-
50
-
51
-
52
-
53
-
54
-
55
-
56
-
57
-
58
-
59
-
60
-
61
-
62
-
63
-
64
-
65
-
66
-
67
-
68
-
69
-
70
-
71
-
72
-
73
-
74
-
75
-
76
-
77
-
78
-
79
-
80
-
81
-
82
-
83
-
84
-
85
-
86
-
87
-
88
-
89
-
90
-
91
-
92
-
93
-
94
-
95
-
96
-
97
-
98
-
99
-
100
-
101
-
102
-
103
-
104
-
105
-
106
-
107
-
108
-
109
-
110
-
111
-
112
-
113
-
114
-
115
-
116
 |
 |

16
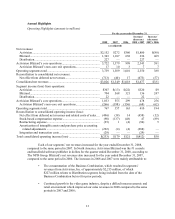
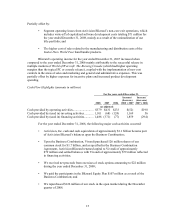
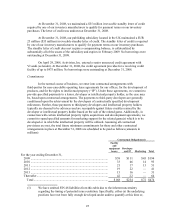
On November 5, 2008, we announced that our Board of Directors authorized a stock
repurchase program under which we may repurchase up to $1 billion of our common stock. Under
this program, we may repurchase our common stock from time to time on the open market or in
private transactions, including structured or accelerated transactions. In December 2008, we
repurchased approximately 13 million shares of our common stock. At December 31, 2008, we
had approximately $874 million available for utilization under the buyback program and no
outstanding stock repurchase transactions. The repurchase program may be suspended or
discontinued by the Company at any time.
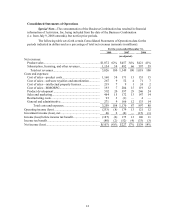
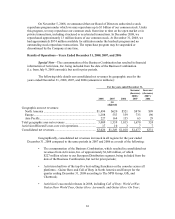
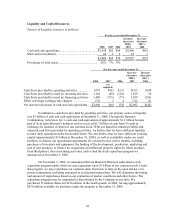
Results of Operations—Years Ended December 31, 2008, 2007, and 2006
Special Note—The consummation of the Business Combination has resulted in financial
information of Activision, Inc. being included from the date of the Business Combination
(i.e. from July 9, 2008 onwards), but not for prior periods.
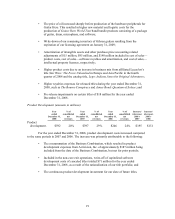
The following table details our consolidated net revenues by geographic area for the
years ended December 31, 2008, 2007, and 2006 (amounts in millions):
For the years ended December 31,
2008 2007 2006
Increase/
(decrease)
2008 v
2007
Increase/
(decrease)
2007 v
2006
(as
adjusted)
Geographic area net revenues:
North America.................................................................... $1,494 $620 $521 $874 $99
Europe................................................................................. 1,288 555 359 733 196
Asia Pacific......................................................................... 227 164 135 63 29
Total geographic area net revenues ........................................ 3,009 1,339 1,015 1,670 324
Activision Blizzard’s non-core exit operations....................... 17 10 3 7 7
Consolidated net revenues...................................................... $3,026 $1,349 $1,018 $1,677 $331
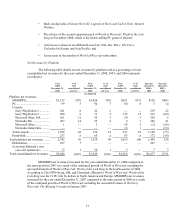
Geographically, consolidated net revenues increased in all regions for the year ended
December 31, 2008 compared to the same periods in 2007 and 2006 as a result of the following:
• The consummation of the Business Combination, which resulted in consolidated net
revenues from Activision, Inc. of approximately $1,648 million, of which
$227 million relates to our European Distribution segment, being included from the
date of the Business Combination, but not for prior periods;
• Activision had two of the top-five best-selling franchises on the consoles across all
platforms—Guitar Hero and Call of Duty in North America and Europe for the
quarter ending December 31, 2008 according to The NPD Group, Gfk, and
Charttrack;
• Activision’s successful releases in 2008, including Call of Duty: World at War,
Guitar Hero World Tour, Guitar Hero: Aerosmith, and Guitar Hero: On Tour;