WeightWatchers 2008 Annual Report Download - page 93
Download and view the complete annual report
Please find page 93 of the 2008 WeightWatchers annual report below. You can navigate through the pages in the report by either clicking on the pages listed below, or by using the keyword search tool below to find specific information within the annual report.-
 1
1 -
2
-
3
-
4
-
5
-
6
-
7
-
8
-
9
-
10
-
11
-
12
-
13
-
14
-
15
-
16
-
17
-
18
-
19
-
20
-
21
-
22
-
23
-
24
-
25
-
26
-
27
-
28
-
29
-
30
-
31
-
32
-
33
-
34
-
35
-
36
-
37
-
38
-
39
-
40
-
41
-
42
-
43
-
44
-
45
-
46
-
47
-
48
-
49
-
50
-
51
-
52
-
53
-
54
-
55
-
56
-
57
-
58
-
59
-
60
-
61
-
62
-
63
-
64
-
65
-
66
-
67
-
68
-
69
-
70
-
71
-
72
-
73
-
74
-
75
-
76
-
77
-
78
-
79
-
80
-
81
-
82
-
 83
83 -
 84
84 -
 85
85 -
 86
86 -
 87
87 -
 88
88 -
 89
89 -
 90
90 -
 91
91 -
 92
92 -
 93
93 -
 94
94 -
 95
95 -
 96
96 -
 97
97 -
 98
98 -
 99
99 -
 100
100 -
 101
101 -
 102
102 -
 103
103 -
104
-
105
-
106
-
107
-
108
 |
 |

WEIGHT WATCHERS INTERNATIONAL, INC. AND SUBSIDIARIES
NOTES TO CONSOLIDATED FINANCIAL STATEMENTS—(Continued)
(IN THOUSANDS, EXCEPT PER SHARE AMOUNTS)
• Level 2—Observable inputs other than Level 1 prices, such as quoted prices for similar assets or
liabilities; quoted prices in markets that are not active; or other inputs that are observable or can be
corroborated by observable market data for substantially the full term of the assets or liabilities.
• Level 3—Unobservable inputs that are supported by little or no market activity and that are significant
to the fair value of the assets or liabilities.
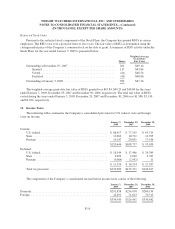
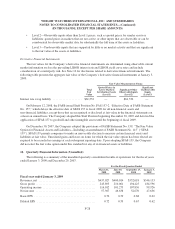
Derivative Financial Instruments
The fair values for the Company’s derivative financial instruments are determined using observable current
market information such as the prevailing LIBOR interest rate and LIBOR yield curve rates and include
consideration of counterparty risk. See Note 16 for disclosures related to derivative financial instruments. The
following table presents the aggregate fair value of the Company’s derivative financial instruments at January 3,
2009:
Fair Value Measurements Using:
Total
Fair
Value
Quoted Prices in
Active Markets
for Identical Assets
(Level 1)
Significant Other
Observable Inputs
(Level 2)
Significant
Unobservable
Inputs
(Level 3)
Interest rate swap liability .................... $61,532 — $61,532 —
On February 12, 2008, the FASB issued Staff Position No. FAS 157-2, “Effective Date of FASB Statement
No. 157,” which delays the effective date of SFAS 157 to fiscal 2009 for all non-financial assets and
non-financial liabilities, except those that are recognized or disclosed at fair value in the financial statements on
at least an annual basis. The Company adopted this Staff Position beginning December 30, 2007 and deferred the
application of SFAS 157 to goodwill and other intangible assets until the beginning of fiscal 2009.
On December 30, 2007, the Company adopted the provisions of FASB Statement No. 159, “The Fair Value
Option for Financial Assets and Liabilities—Including an amendment of FASB Statement No. 115” (“SFAS
159”). SFAS 159 permits companies to make an irrevocable election to measure certain financial assets and
liabilities at fair value. Unrealized gains and losses on items for which the fair value option has been elected are
required to be recorded in earnings at each subsequent reporting date. Upon adopting SFAS 159, the Company
did not elect the fair value option under this standard for any of its financial assets or liabilities.
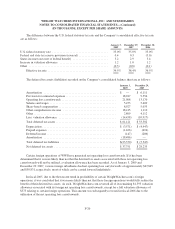
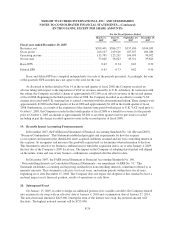
18. Quarterly Financial Information (Unaudited)
The following is a summary of the unaudited quarterly consolidated results of operations for the fiscal years
ended January 3, 2009 and December 29, 2007.
For the Fiscal Quarters Ended
March 31,
2008
June 30,
2008
September 27,
2008
January 3,
2009
Fiscal year ended January 3, 2009
Revenues, net ....................................... $437,027 $400,014 $352,618 $346,153
Gross profit ......................................... 245,895 210,061 194,425 184,596
Operating income .................................... 116,012 101,273 107,836 99,926
Net income ......................................... 57,367 46,638 52,670 47,656
Basic EPS .......................................... 0.72 0.59 0.68 0.62
Diluted EPS ........................................ 0.72 0.59 0.67 0.62
F-28