WeightWatchers 2008 Annual Report Download - page 91
Download and view the complete annual report
Please find page 91 of the 2008 WeightWatchers annual report below. You can navigate through the pages in the report by either clicking on the pages listed below, or by using the keyword search tool below to find specific information within the annual report.-
 1
1 -
2
-
3
-
4
-
5
-
6
-
7
-
8
-
9
-
10
-
11
-
12
-
13
-
14
-
15
-
16
-
17
-
18
-
19
-
20
-
21
-
22
-
23
-
24
-
25
-
26
-
27
-
28
-
29
-
30
-
31
-
32
-
33
-
34
-
35
-
36
-
37
-
38
-
39
-
40
-
41
-
42
-
43
-
44
-
45
-
46
-
47
-
48
-
49
-
50
-
51
-
52
-
53
-
54
-
55
-
56
-
57
-
58
-
59
-
60
-
61
-
62
-
63
-
64
-
65
-
66
-
67
-
68
-
69
-
70
-
71
-
72
-
73
-
74
-
75
-
76
-
77
-
78
-
79
-
80
-
 81
81 -
 82
82 -
 83
83 -
 84
84 -
 85
85 -
 86
86 -
 87
87 -
 88
88 -
 89
89 -
 90
90 -
 91
91 -
 92
92 -
 93
93 -
 94
94 -
 95
95 -
 96
96 -
 97
97 -
 98
98 -
 99
99 -
 100
100 -
 101
101 -
102
-
103
-
104
-
105
-
106
-
107
-
108
 |
 |

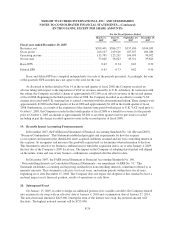
WEIGHT WATCHERS INTERNATIONAL, INC. AND SUBSIDIARIES
NOTES TO CONSOLIDATED FINANCIAL STATEMENTS—(Continued)
(IN THOUSANDS, EXCEPT PER SHARE AMOUNTS)
Year Ended December 30, 2006
Weight
Watchers
International WeightWatchers.com
Intercompany
Eliminations Consolidated
Revenues from external customers ............ $1,102,181 $131,144 $ — $1,233,325
Intercompany revenue ...................... 12,399 3,023 (15,422) —
Total revenue ......................... $1,114,580 $134,167 (15,422) $1,233,325
Depreciation and amortization ................ $ 10,296 $ 4,584 $ — $ 14,880
Operating income .......................... $ 331,779 $ 48,269 $ — $ 380,048
Interest expense ....................... 49,532
Other income, net ...................... (1,447)
Early extinguishment of debt ............. 1,321
Provision for taxes ..................... 120,817
Net income ............................... $ 209,825
Total assets ............................... $1,075,843 $ 41,782 $(116,914) $1,000,711
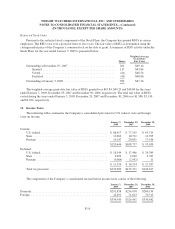
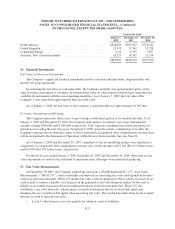
The following table presents information about the Company’s sources of revenue and other information by
geographic area. There were no material amounts of sales or transfers among geographic areas and no material
amounts of United States export sales.
Revenues for the Year Ended
January 3,
2009
December 29,
2007
December 30,
2006
NACO meeting fees ......................................... $ 625,277 $ 603,730 $ 471,751
International Company-owned meeting fees ...................... 282,807 276,994 251,337
Product sales .............................................. 339,775 337,659 293,286
Franchise royalties .......................................... 16,186 17,039 19,168
Internet revenues ........................................... 185,806 151,625 129,420
Other .................................................... 85,961 80,120 68,363
$1,535,812 $1,467,167 $1,233,325
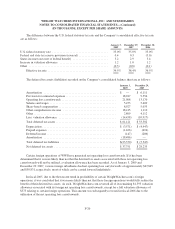
Revenues for the Year Ended
January 3,
2009
December 29,
2007
December 30,
2006
North America ............................................. $1,016,698 $ 972,976 $ 801,373
United Kingdom ............................................ 180,114 199,240 161,431
Continental Europe ......................................... 281,053 237,196 215,151
Australia, New Zealand and other .............................. 57,947 57,755 55,370
$1,535,812 $1,467,167 $1,233,325
F-26