WeightWatchers 2008 Annual Report Download - page 52
Download and view the complete annual report
Please find page 52 of the 2008 WeightWatchers annual report below. You can navigate through the pages in the report by either clicking on the pages listed below, or by using the keyword search tool below to find specific information within the annual report.-
 1
1 -
2
-
3
-
4
-
5
-
6
-
7
-
8
-
9
-
10
-
11
-
12
-
13
-
14
-
15
-
16
-
17
-
18
-
19
-
20
-
21
-
22
-
23
-
24
-
25
-
26
-
27
-
28
-
29
-
30
-
31
-
32
-
33
-
34
-
35
-
36
-
37
-
38
-
39
-
40
-
41
-
 42
42 -
 43
43 -
 44
44 -
 45
45 -
 46
46 -
 47
47 -
 48
48 -
 49
49 -
 50
50 -
 51
51 -
 52
52 -
 53
53 -
 54
54 -
 55
55 -
 56
56 -
 57
57 -
 58
58 -
 59
59 -
 60
60 -
 61
61 -
 62
62 -
63
-
64
-
65
-
66
-
67
-
68
-
69
-
70
-
71
-
72
-
73
-
74
-
75
-
76
-
77
-
78
-
79
-
80
-
81
-
82
-
83
-
84
-
85
-
86
-
87
-
88
-
89
-
90
-
91
-
92
-
93
-
94
-
95
-
96
-
97
-
98
-
99
-
100
-
101
-
102
-
103
-
104
-
105
-
106
-
107
-
108
 |
 |
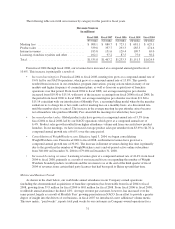
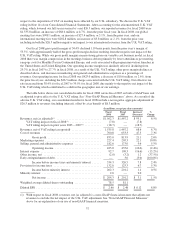
2008 from $151.6 million for fiscal 2007. End-of-period active Weight Watchers Online subscribers increased
16.3%, from 584,000 at December 29, 2007 to 679,000 at January 3, 2009. Strong signup volumes in all geographies,
combined with the launch of Weight Watchers Online in France and the Netherlands, contributed to this growth.
Other revenue, comprised primarily of licensing revenues and our publications, was $85.9 million for fiscal
2008, an increase of $5.7 million, or 7.1%, from $80.2 million for fiscal 2007. Licensing revenues increased $7.2
million globally, or 12.3%, as a result of higher royalties in NACO from our existing ice cream and yogurt
licenses and new product licenses, as well as higher U.K. royalties on various other products.
Franchise royalties in fiscal 2008 were $10.8 million in NACO and $5.4 million internationally. Total
franchise royalties were $16.2 million in fiscal 2008, and were $0.8 million lower than fiscal 2007; however,
excluding lost commissions resulting from our recent franchise acquisitions, franchise royalties rose 1.6%.
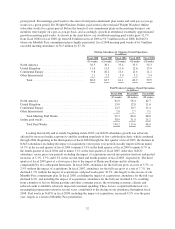
Cost of revenues was $700.8 million for fiscal 2008, an increase of $47.5 million, or 7.3%, from $653.3
million for fiscal 2007. Our reported gross profit margin dropped 110 basis points, from 55.5% in fiscal 2007 to
54.4% in fiscal 2008. Excluding the net aggregate adjustment for the U.K. VAT ruling, our gross margin was
55.1% for fiscal 2008, a decline of 40 basis points from the prior year. The decline in this adjusted gross margin
was due to start-up costs for Monthly Pass in Continental Europe, lower meeting averages in some of the
countries in which we operate, and lower product sales margins in NACO driven by change in product mix and
higher supply chain costs. WeightWatchers.com, which carries a structurally higher gross margin, continued its
trend of year over year gross margin expansion. Excluding the net aggregate adjustment for the U.K. VAT ruling,
our gross profit increased $47.6 million, or 5.8%, to $861.5 million in fiscal 2008 from $813.9 million in fiscal
2007.
Marketing expenses for fiscal 2008 rose $22.1 million, or 10.8%, to $227.4 million, from $205.3 million for
fiscal 2007, with the unfavorable effect of foreign currency exchange rates accounting for $3.3 million of the
increase. We made significant marketing investments in the WW.com business during fiscal 2008 which proved
successful, including using television advertising for the first time in the United Kingdom and Germany, and
increasing our online advertising in all WeightWatchers.com geographies. In the meetings business, our
international geographies experienced an increase in marketing expenses, driven by a combination of more
expensive primetime television media coupled with additional television advertising in Continental Europe,
partially to support the launch of our new programs there. Excluding the net adjustment to revenues for the U.K.
VAT ruling, our marketing expenses were 14.6% of revenues for fiscal 2008, versus 14.0% in fiscal 2007. On a
reported basis, marketing expenses for fiscal 2008 were 14.8% of revenues.
Selling, general and administrative expenses were $182.6 million for fiscal 2008, versus $173.0 million for
fiscal 2007, an increase of $9.6 million, or 5.5%. Information technology costs remain the significant driver of
the increase, representing our ongoing investment to upgrade our systems infrastructure. Higher expense in this
area resulted from a combination of increased depreciation as we brought new information technology systems
online, and higher maintenance costs related to new systems already put in service. Expenses of our China Joint
Venture contributed $4.7 million to the increase. Excluding the net adjustment to revenues for the U.K. VAT
ruling, selling, general and administrative expenses were down slightly versus last year as a percentage of net
revenues, at 11.7% for fiscal 2008, versus 11.8% in the fiscal 2007. On a reported basis, selling, general and
administrative expenses for fiscal 2008 were 11.9% of revenues.
Our reported operating income for fiscal 2008 was $425.0 million, a decrease of $10.6 million, or 2.4%, versus
fiscal 2007. Excluding the net adjustment for the U.K. VAT ruling, our operating income was $451.5 million for
fiscal 2008 versus $435.6 million in fiscal 2007, an increase of $15.9 million, or 3.7%. Excluding the net adjustment
for the U.K. VAT ruling, our adjusted operating income margin for fiscal 2008 was 28.9%, a decrease of 80 basis
points from 29.7% in fiscal 2007, as a result of the decline in gross margin coupled with higher marketing expense.
Our reported operating income margin declined from 29.7% for fiscal 2007 to 27.7% for fiscal 2008.
Interest expense was $92.7 million for fiscal 2008, a decrease of $16.6 million, or 15.2%, from $109.3
million for fiscal 2007, due to lower effective interest rates and a $44.0 million decrease in our average debt
39