WeightWatchers 2008 Annual Report Download - page 53
Download and view the complete annual report
Please find page 53 of the 2008 WeightWatchers annual report below. You can navigate through the pages in the report by either clicking on the pages listed below, or by using the keyword search tool below to find specific information within the annual report.-
 1
1 -
2
-
3
-
4
-
5
-
6
-
7
-
8
-
9
-
10
-
11
-
12
-
13
-
14
-
15
-
16
-
17
-
18
-
19
-
20
-
21
-
22
-
23
-
24
-
25
-
26
-
27
-
28
-
29
-
30
-
31
-
32
-
33
-
34
-
35
-
36
-
37
-
38
-
39
-
40
-
41
-
42
-
 43
43 -
 44
44 -
 45
45 -
 46
46 -
 47
47 -
 48
48 -
 49
49 -
 50
50 -
 51
51 -
 52
52 -
 53
53 -
 54
54 -
 55
55 -
 56
56 -
 57
57 -
 58
58 -
 59
59 -
 60
60 -
 61
61 -
 62
62 -
 63
63 -
64
-
65
-
66
-
67
-
68
-
69
-
70
-
71
-
72
-
73
-
74
-
75
-
76
-
77
-
78
-
79
-
80
-
81
-
82
-
83
-
84
-
85
-
86
-
87
-
88
-
89
-
90
-
91
-
92
-
93
-
94
-
95
-
96
-
97
-
98
-
99
-
100
-
101
-
102
-
103
-
104
-
105
-
106
-
107
-
108
 |
 |

outstanding. The average effective interest rate for fiscal 2008 decreased to 5.44%, from 6.39% in fiscal 2007, a
result of a decline in LIBOR combined with the 0.25% reduction in our interest rate spread over LIBOR for the
Term Loan A, Additional Term Loan A and our revolving credit facility, or the Revolver, which took effect at
the end of February 2008.
For fiscal 2008, we reported other income of $2.0 million, versus $3.2 million in fiscal 2007. The decrease
is primarily the result of the impact of foreign currency exchange rates on intercompany transactions.
In fiscal 2007, we recorded a charge of $3.0 million for early extinguishment of debt. This charge reflected
the write-off of deferred financing costs associated with the WW.com Credit Facilities, which were paid down
during that period (as further explained in Note 7 to the Consolidated Financial Statements).
The effective tax rate on our reported results for fiscal 2008 was 39.5%, versus 38.4% in fiscal 2007.
Excluding the adjustment for the U.K. VAT ruling, our effective tax rate for fiscal 2008 was 38.9%.
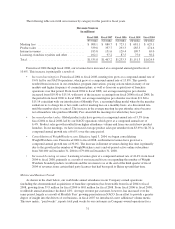
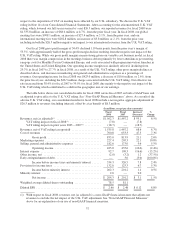
Comparison of Fiscal 2007 (52 weeks) to Fiscal 2006 (52 weeks)
Fiscal
2007
Fiscal
2006
Increase/
(Decrease)
%
Change
Revenues ................................................ $1,467.2 $1,233.3 $233.9 19.0%
Cost of revenues ........................................... 653.3 557.1 96.2 17.3%
Gross profit ........................................... 813.9 676.2 137.7 20.4%
Marketing expenses ........................................ 205.3 158.9 46.4 29.2%
Selling, general and administrative expenses ..................... 173.0 137.3 35.7 26.0%
Operating income ...................................... 435.6 380.0 55.6 14.6%
Interest expense, net ........................................ 109.3 49.5 59.8 120.8%
Other income, net .......................................... (3.2) (1.4) (1.8) 128.6%
Early extinguishment of debt ................................. 3.0 1.3 1.7 130.8%
Income before taxes .................................... 326.5 330.6 (4.1) (1.2%)
Provision for income taxes ................................... 125.3 120.8 4.5 3.7%
Net income ........................................... $ 201.2 $ 209.8 $ (8.6) (4.1%)
Weighted average diluted common shares outstanding ............. 81.1 99.4
Diluted EPS .............................................. $ 2.48 $ 2.11 $ 0.37 17.5%
Net revenues were $1,467.2 million for fiscal 2007, an increase of $233.9 million, or 19.0%, from $1,233.3
million for fiscal 2006. This $233.9 million increase was driven primarily by a $157.6 million increase in meeting
fees and a $44.4 million increase in product sales, both a result of attendance growth and higher average sales per
attendee. Internet and licensing revenues grew $22.2 million and $10.4 million, respectively, with the growth
partially offset by a $0.7 million decrease in other revenues primarily resulting from lower franchise royalties. Net
revenues were positively impacted by foreign currency exchange rates in the amount of $43.0 million or 3.5%.
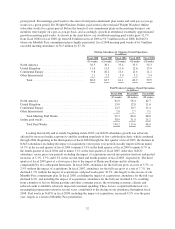
For fiscal 2007, total global meeting fees were $880.7 million versus $723.1 million for fiscal 2006, an
increase of $157.6 million, or 21.8% including the favorable impact of foreign currency translation. Globally,
attendance volume reached 62.7 million for fiscal 2007, up 2.6% from 61.1 million in the prior year. NACO and
the United Kingdom grew attendance volumes, while Continental Europe declined. In fiscal 2007, there were
84.6 million paid weeks in the global meetings business, a 22.8% increase from the prior year level. The excess
of paid weeks’ growth over attendance growth was the key driver of the 15.4% increase in the average meeting
fee per attendee on a constant currency basis. The paid weeks metric for meetings, which we began to furnish in
fiscal 2007 in order to provide greater transparency, captures total Weight Watchers paid membership by adding
pay-as-you-go attendance to paid commitment plan weeks.
40