WeightWatchers 2008 Annual Report Download - page 50
Download and view the complete annual report
Please find page 50 of the 2008 WeightWatchers annual report below. You can navigate through the pages in the report by either clicking on the pages listed below, or by using the keyword search tool below to find specific information within the annual report.-
 1
1 -
2
-
3
-
4
-
5
-
6
-
7
-
8
-
9
-
10
-
11
-
12
-
13
-
14
-
15
-
16
-
17
-
18
-
19
-
20
-
21
-
22
-
23
-
24
-
25
-
26
-
27
-
28
-
29
-
30
-
31
-
32
-
33
-
34
-
35
-
36
-
37
-
38
-
39
-
 40
40 -
 41
41 -
 42
42 -
 43
43 -
 44
44 -
 45
45 -
 46
46 -
 47
47 -
 48
48 -
 49
49 -
 50
50 -
 51
51 -
 52
52 -
 53
53 -
 54
54 -
 55
55 -
 56
56 -
 57
57 -
 58
58 -
 59
59 -
 60
60 -
61
-
62
-
63
-
64
-
65
-
66
-
67
-
68
-
69
-
70
-
71
-
72
-
73
-
74
-
75
-
76
-
77
-
78
-
79
-
80
-
81
-
82
-
83
-
84
-
85
-
86
-
87
-
88
-
89
-
90
-
91
-
92
-
93
-
94
-
95
-
96
-
97
-
98
-
99
-
100
-
101
-
102
-
103
-
104
-
105
-
106
-
107
-
108
 |
 |

respect to the imposition of VAT on meeting fees collected by our U.K. subsidiary. We discuss the U.K. VAT
ruling in Note 14 of our Consolidated Financial Statements. After accounting for the aforementioned U.K. VAT
ruling, which lowered our full year revenues by a net $26.5 million, our reported revenues for fiscal 2008 were
$1,535.8 million, an increase of $68.6 million, or 4.7%, from the prior fiscal year. In fiscal 2008, our global
meeting fees were $908.1 million, an increase of $27.4 million, or 3.1%, from the prior year, and our
international meeting fees were $282.8 million, an increase of $5.8 million, or 2.1%, from the prior year,
including in both the $26.5 million negative net impact to our international revenues from the U.K. VAT ruling.
Our fiscal 2008 gross profit margin of 54.4% declined 110 basis points from the prior year’s margin of
55.5%, with approximately half of the gross profit margin decline resulting from the negative net impact of the
U.K. VAT ruling. While our gross profit margins remain strong given our variable cost business model, in fiscal
2008 there was margin compression in the meetings business driven primarily by fewer attendances per meeting,
ramp up costs for Monthly Pass in Continental Europe, and costs associated with program innovation launches in
the United States and United Kingdom. Our operating income margin was similarly affected, declining from
29.7% in fiscal 2007 to 27.7% in fiscal 2008, as a result of the U.K. VAT ruling, other gross margin declines as
described above, and increases in marketing and general and administrative expenses as a percentage of
revenues. Our operating income for fiscal 2008 was $425.0 million, a decrease of $10.6 million, or 2.4%, from
the prior fiscal year, including the $26.5 million charge associated with the U.K. VAT ruling. Our effective tax
rate increased from 38.4% for fiscal 2007 to 39.5% for fiscal 2008, due mainly to the negative net impact of the
U.K. VAT ruling which contributed to a shift in the geographic mix of our earnings.
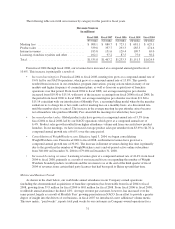
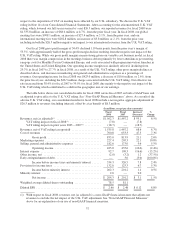
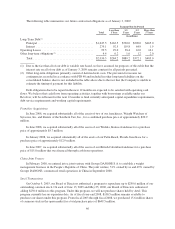
The table below shows our consolidated results for fiscal 2008 versus fiscal 2007 on both a GAAP basis and
as adjusted to give effect to the U.K. VAT ruling. See “Non-GAAP Financial Measures” above. As a result of the
adverse U.K. VAT ruling, our consolidated results for fiscal 2008 include a net negative aggregate adjustment of
$26.5 million to revenues (including interest), offset by a tax benefit of $8.3 million.
(In millions, except per share amounts)
Fiscal
2008
Fiscal
2007
Increase/
(Decrease)
%
Change
Revenues, net (as adjusted)(1) .............................. $1,562.3 $1,467.2 $ 95.1 6.5%
VAT ruling impact on fiscal 2008(1) ..................... (7.8) — (7.8)
VAT ruling impact on prior years 2005 – 2007(1) ........... (18.7) — (18.7)
Revenues, net of VAT ruling (as reported) .................... 1,535.8 1,467.2 68.6 4.7%
Cost of revenues ........................................ 700.8 653.3 47.5 7.3%
Gross profit .................................... 835.0 813.9 21.1 2.6%
Marketing expenses ...................................... 227.4 205.3 22.1 10.8%
Selling, general and administrative expenses .................. 182.6 173.0 9.6 5.5%
Operating income ............................... 425.0 435.6 (10.6) (2.4%)
Interest expense ......................................... 92.7 109.3 (16.6) (15.2%)
Other income, net ....................................... (2.0) (3.2) 1.2 (37.5%)
Early extinguishment of debt ............................... — 3.0 (3.0) (100.0%)
Income before income taxes and minority interest ...... 334.3 326.5 7.8 2.4%
Provision for income taxes ................................ 132.0 125.3 6.7 5.3%
Income before minority interest .................... 202.3 201.2 1.1 0.5%
Minority interest ........................................ 2.0 — 2.0
Net income ..................................... $ 204.3 $ 201.2 $ 3.1 1.5%
Weighted average diluted shares outstanding .................. 78.5 81.1
Diluted EPS ............................................ $ 2.60 $ 2.48 $ 0.12 4.8%
(1) With respect to fiscal 2008, revenues, net (as adjusted) is a non-GAAP financial measure that adjusts net
revenues to exclude the net impact of the U.K. VAT adjustment. See “Non-GAAP Financial Measures”
above for an explanation of our use of non-GAAP financial measures.
37