WeightWatchers 2008 Annual Report Download - page 46
Download and view the complete annual report
Please find page 46 of the 2008 WeightWatchers annual report below. You can navigate through the pages in the report by either clicking on the pages listed below, or by using the keyword search tool below to find specific information within the annual report.-
 1
1 -
2
-
3
-
4
-
5
-
6
-
7
-
8
-
9
-
10
-
11
-
12
-
13
-
14
-
15
-
16
-
17
-
18
-
19
-
20
-
21
-
22
-
23
-
24
-
25
-
26
-
27
-
28
-
29
-
30
-
31
-
32
-
33
-
34
-
35
-
 36
36 -
 37
37 -
 38
38 -
 39
39 -
 40
40 -
 41
41 -
 42
42 -
 43
43 -
 44
44 -
 45
45 -
 46
46 -
 47
47 -
 48
48 -
 49
49 -
 50
50 -
 51
51 -
 52
52 -
 53
53 -
 54
54 -
 55
55 -
 56
56 -
57
-
58
-
59
-
60
-
61
-
62
-
63
-
64
-
65
-
66
-
67
-
68
-
69
-
70
-
71
-
72
-
73
-
74
-
75
-
76
-
77
-
78
-
79
-
80
-
81
-
82
-
83
-
84
-
85
-
86
-
87
-
88
-
89
-
90
-
91
-
92
-
93
-
94
-
95
-
96
-
97
-
98
-
99
-
100
-
101
-
102
-
103
-
104
-
105
-
106
-
107
-
108
 |
 |
In the United Kingdom, after four years of attendance increases, attendance declined 3.1% in fiscal 2005
and 7.4% in fiscal 2006. The declining trend began as a result of a negative member and leader reaction to a new
program innovation launched in January 2005. We worked to simplify the program, improve the meeting
experience, and strengthen the quality of our field management and leader force. As a result, over the course of
fiscal 2006, the negative U.K. attendance trend reversed from a negative 17.2% year-over-year decline in the first
quarter, to 7.0% year-over-year growth in the fourth quarter. This trend continued into the first quarter of 2007
with a growth rate of 9.8% versus the prior year period, but the growth slowed to 2.2% in the second quarter
versus the prior year period and turned negative in the second half of fiscal 2007, posting declines of 4.2% and
2.4% in the third and fourth quarters of fiscal 2007, respectively, versus the prior year periods. Paid weeks rose
9.7%, from 11.6 million in fiscal 2006 to 12.8 million in fiscal 2007. In fiscal 2008, attendance in the United
Kingdom declined 2.4% versus the prior year. The U.K. market has responded positively to its new program that
was soft-launched in December 2008, but like the U.S. market, the U.K. market has experienced a worsening
economy which has negatively impacted attendance. In fiscal 2008, paid weeks grew 17.4% versus the prior
year, due largely to the introduction of Monthly Pass in the third quarter of fiscal 2007.
Continental Europe saw attendance growth in every fiscal year from 2000 through 2005. Continental
Europe’s attendance increased 1.1 million in fiscal 2004 primarily as a result of a program innovation in the third
quarter which helped drive increased attendance into fiscal 2005 and the first quarter of 2006; however, on a full
year basis in fiscal 2006, attendances in Continental Europe declined by 4.4% versus the prior year. Attendance
began to decline in the second quarter of fiscal 2006, by 7.2% in the second quarter, 7.8% in the third quarter and
10.6% in the fourth quarter, in each case versus the prior year period. We believe that the growth of the business
in Continental Europe prior to fiscal 2006 outpaced the expertise of the local management, and we have been
strengthening these teams. The declining attendance trend continued into fiscal 2007 (declines of 6.6% in the first
quarter, 7.5% in the second quarter, 11.7% in the third quarter and 9.4% in the fourth quarter, in each case versus
the prior year period) and ended the year with attendance 8.5% below the prior year level. Paid weeks in
Continental Europe declined 6.2%, from 11.4 million in fiscal 2006 to 10.7 million in fiscal 2007. We believe
that most of this weakness was the result of ineffective marketing and the resultant lack of new enrollments. In
fiscal 2008, Continental Europe experienced a 4.1% decline in attendance versus the prior year. However, the
introduction of Monthly Pass in Germany in the third quarter of fiscal 2007 and in France in April 2008 helped
drive an overall 16.5% increase in paid weeks for fiscal 2008 in Continental Europe versus the prior year.
The continued success of our WeightWatchers.com segment resulted in an increase in the number of online
paid weeks of 54.4%, from 25.2 million in fiscal 2006 to 38.9 million in fiscal 2008. This success is due largely
to the acquisition of new Weight Watchers Online subscribers in the United States as well as the launch of
WeightWatchers.com subscription products in new markets.
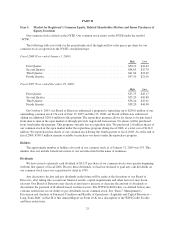
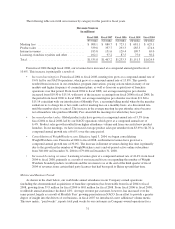
The Company has maintained an annual gross margin of 50% or more since fiscal 2001. Our staff is usually
paid on a commission basis and space is typically rented as needed. Moreover, we adjust the number of meetings
according to demand, including seasonal fluctuations. This variable cost structure has enabled us to maintain
these high margins even as we have expanded the number of our meetings over this period. When our attendance
growth outpaces our meeting growth, our gross margins typically improve. As our WeightWatchers.com business
continues to grow, we expect margins to continue to expand in this highly scalable business.
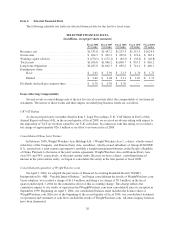
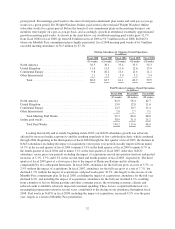
The Company has consistently generated operating income margins of 30% or more from fiscal 2001 to fiscal
2007, even while making significant investments in strengthening our management teams, particularly in North
America and Continental Europe, putting in place a stronger global marketing infrastructure, increasing our
investments in marketing and information technology and expensing share-based compensation beginning in fiscal
2006. In fiscal 2008, the operating income margin of the Company dipped below 30%, to 28%, due largely to the
adverse U.K. VAT ruling received in the second quarter of fiscal 2008 and the start-up costs of our China Joint
Venture.
33