WeightWatchers 2008 Annual Report Download - page 45
Download and view the complete annual report
Please find page 45 of the 2008 WeightWatchers annual report below. You can navigate through the pages in the report by either clicking on the pages listed below, or by using the keyword search tool below to find specific information within the annual report.-
 1
1 -
2
-
3
-
4
-
5
-
6
-
7
-
8
-
9
-
10
-
11
-
12
-
13
-
14
-
15
-
16
-
17
-
18
-
19
-
20
-
21
-
22
-
23
-
24
-
25
-
26
-
27
-
28
-
29
-
30
-
31
-
32
-
33
-
34
-
 35
35 -
 36
36 -
 37
37 -
 38
38 -
 39
39 -
 40
40 -
 41
41 -
 42
42 -
 43
43 -
 44
44 -
 45
45 -
 46
46 -
 47
47 -
 48
48 -
 49
49 -
 50
50 -
 51
51 -
 52
52 -
 53
53 -
 54
54 -
 55
55 -
56
-
57
-
58
-
59
-
60
-
61
-
62
-
63
-
64
-
65
-
66
-
67
-
68
-
69
-
70
-
71
-
72
-
73
-
74
-
75
-
76
-
77
-
78
-
79
-
80
-
81
-
82
-
83
-
84
-
85
-
86
-
87
-
88
-
89
-
90
-
91
-
92
-
93
-
94
-
95
-
96
-
97
-
98
-
99
-
100
-
101
-
102
-
103
-
104
-
105
-
106
-
107
-
108
 |
 |

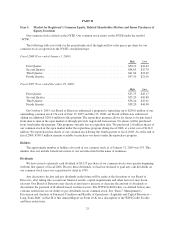
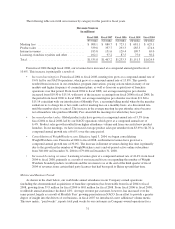
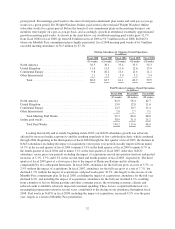
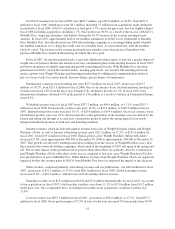
given period. For meetings, paid weeks is the sum of total paid commitment plan weeks and total pay-as-you-go
weeks for a given period. For Weight Watchers Online, paid weeks is the total paid Weight Watchers Online
subscriber weeks for a given period. Before the launch of our commitment plans in the meetings business, our
members were largely on a pay-as-you-go basis, and accordingly, growth in attendance essentially approximated
growth in meeting paid weeks. As shown in the chart below, our worldwide meeting paid weeks grew 32.7%
from fiscal 2006 to fiscal 2008, up from 68.8 million in fiscal 2006 to 91.3 million in fiscal 2008. In NACO,
where our Monthly Pass commitment plan is highly penetrated, fiscal 2008 meeting paid weeks of 61.0 million
exceeded meeting attendance of 36.5 million by 67.1%.
Meeting Attendance in Company-Owned Operations
(in millions)
Fiscal 2008 Fiscal 2007 Fiscal 2006 Fiscal 2005 Fiscal 2004
(53 weeks) (52 weeks) (52 weeks) (52 weeks) (52 weeks)
North America ............................... 36.5 38.1 35.4 33.5 32.3
United Kingdom ............................. 11.6 11.9 11.6 12.6 13.0
Continental Europe ........................... 9.8 10.2 11.1 11.6 11.2
Other International ........................... 2.1 2.5 3.0 3.2 3.4
Total ................................... 60.0 62.7 61.1 60.9 59.9
Paid Weeks in Company-Owned Operations
(in millions)
Fiscal 2008 Fiscal 2007 Fiscal 2006
(53 weeks) (52 weeks) (52 weeks)
North America .............................................. 61.0 58.4 42.7
United Kingdom ............................................. 15.0 12.8 11.6
Continental Europe ........................................... 12.5 10.7 11.4
Other International ........................................... 2.8 2.7 3.1
Total Meeting Paid Weeks ................................. 91.3 84.6 68.8
Online paid weeks ............................................ 38.9 31.0 25.2
Total Paid Weeks ........................................ 130.2 115.6 94.0
Looking historically and at trends, beginning in late 2003, our NACO attendance growth was adversely
affected by increased media exposure to and the resulting popularity of low-carbohydrate diets, which continued
through 2004. Beginning in the third quarter of fiscal 2004 through the first quarter of fiscal 2005, the declines in
NACO attendance excluding the impact of acquisitions versus prior year periods steadily improved from minus
16.7% in the second quarter of fiscal 2004 to minus 13.9% in the third quarter of fiscal 2004 to minus 8.7% in
the fourth quarter of fiscal 2004 and to minus 5.1% in the first quarter of fiscal 2005. After that, NACO
attendance versus prior year periods excluding the impact of acquisitions moved into positive territory and posted
increases of 5.3%, 1.3% and 6.5% in the second, third and fourth quarters of fiscal 2005, respectively. The third
quarter of fiscal 2005 grew at a slower pace due to the impact of Hurricane Katrina and its aftermath,
compounded by two subsequent hurricanes. In fiscal 2006, attendance for the full year grew at a rate of 5.7%, or
2.9% without the impact of acquisitions. In fiscal 2007, attendance for the full year grew at a rate of 7.7%, but
declined 1.7% without the impact of acquisitions, and paid weeks grew 36.5%, due largely to the success of our
Monthly Pass commitment plan. In fiscal 2008, excluding the impact of acquisitions, attendance for the full year
declined 6.2%, and including the impact of acquisitions, attendance for the full year declined 4.3%, resulting
from a number of factors. Rising gasoline and other consumer prices, the worsening economic climate and
reduced credit availability adversely impacted consumer spending. These factors, coupled with the lack of a
meaningful program innovation in several years, contributed to the decline in our attendance throughout fiscal
2008. Paid weeks in NACO in fiscal 2008, including the impact of acquisitions, increased 4.5% over the prior
year, largely as a result of Monthly Pass penetration.
32