WeightWatchers 2008 Annual Report Download - page 44
Download and view the complete annual report
Please find page 44 of the 2008 WeightWatchers annual report below. You can navigate through the pages in the report by either clicking on the pages listed below, or by using the keyword search tool below to find specific information within the annual report.-
 1
1 -
2
-
3
-
4
-
5
-
6
-
7
-
8
-
9
-
10
-
11
-
12
-
13
-
14
-
15
-
16
-
17
-
18
-
19
-
20
-
21
-
22
-
23
-
24
-
25
-
26
-
27
-
28
-
29
-
30
-
31
-
32
-
33
-
 34
34 -
 35
35 -
 36
36 -
 37
37 -
 38
38 -
 39
39 -
 40
40 -
 41
41 -
 42
42 -
 43
43 -
 44
44 -
 45
45 -
 46
46 -
 47
47 -
 48
48 -
 49
49 -
 50
50 -
 51
51 -
 52
52 -
 53
53 -
 54
54 -
55
-
56
-
57
-
58
-
59
-
60
-
61
-
62
-
63
-
64
-
65
-
66
-
67
-
68
-
69
-
70
-
71
-
72
-
73
-
74
-
75
-
76
-
77
-
78
-
79
-
80
-
81
-
82
-
83
-
84
-
85
-
86
-
87
-
88
-
89
-
90
-
91
-
92
-
93
-
94
-
95
-
96
-
97
-
98
-
99
-
100
-
101
-
102
-
103
-
104
-
105
-
106
-
107
-
108
 |
 |

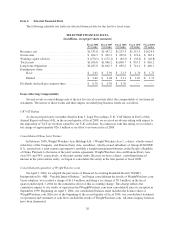
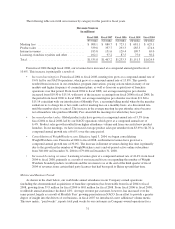
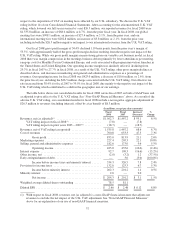
The following table sets forth our revenues by category for the past five fiscal years.
Revenue Sources
(in millions)
Fiscal 2008 Fiscal 2007 Fiscal 2006 Fiscal 2005 Fiscal 2004
(53 weeks) (52 weeks) (52 weeks) (52 weeks) (52 weeks)
Meeting fees ................................ $ 908.1 $ 880.7 $ 723.1 $ 681.1 $ 629.1
Product sales ................................ 339.8 337.7 293.3 285.5 274.6
Internet revenues ............................. 185.8 151.6 129.4 109.7 65.0
Licensing, franchise royalties and other ........... 102.1 97.2 87.5 75.0 56.2
Total ....................................... $1,535.8 $1,467.2 $1,233.3 $1,151.3 $1,024.9
From fiscal 2004 through fiscal 2008, our revenues have increased at a compound annual growth rate of
10.6%. This increase is principally a result of:
•Increased meeting fees. From fiscal 2004 to fiscal 2008, meeting fees grew at a compound annual rate of
9.6% led by our NACO operations, which grew at a compound annual rate of 13.8%. This growth
resulted from increases in our attendance, program innovations, pricing actions taken in many of our
markets and higher frequency of commitment plans, as well as from our acquisitions of franchise
operations over that period. From fiscal 2004 to fiscal 2008, our average meeting fee per attendee
increased from $10.50 to $15.14, with most of the increase occurring from fiscal 2006 to fiscal 2008. In
the period from fiscal 2006 to fiscal 2008, our average meeting fee per attendee rose from $11.84 to
$15.14 coincident with our introduction of Monthly Pass, a recurring billing model whereby the member
authorizes us to charge his or her credit card for meeting fees on a monthly basis, at a discounted rate,
until the member elects to cancel. The increase in the average meeting fee per attendee arises because
not all members who purchase Monthly Pass attend all the meetings for which they have paid.
•Increased product sales. Global product sales have grown at a compound annual rate of 5.5% from
fiscal 2004 to fiscal 2008, led by our NACO operations which grew at a compound annual rate of
6.4%. Product sales growth resulted from higher attendance volume and from successful new product
launches. In our meetings, we have increased average product sales per attendee from $3.69 to $4.76 (a
compound annual growth rate of 6.6%) over the same period.
•Consolidation of WeightWatchers.com. Effective April 3, 2004, we began consolidating
WeightWatchers.com. From fiscal 2004 to fiscal 2008, our Internet revenues have grown at a
compound annual growth rate of 30.0%. The increase in Internet revenues during this time is primarily
due to the growth in the number of WeightWatchers.com’s end-of-period active online subscribers
from 340,000 on December 31, 2004 to 679,000 on December 31, 2008.
•Increased licensing revenues. Licensing revenues grew at a compound annual rate of 41.4% from fiscal
2004 to fiscal 2008, primarily as a result of our increased focus on expanding the number of Weight
Watchers branded products worldwide and the reversion to us at the end of the third quarter of fiscal
2004 of revenues from certain third party licenses that had been paid to Heinz up until that time.
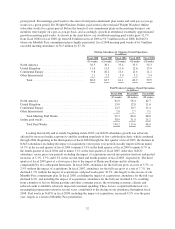
Metrics and Business Trends
As shown in the chart below, our worldwide annual attendance in our Company-owned operations
(including the aforementioned acquisitions of franchise operations) has been stable from fiscal 2004 to fiscal
2008, growing from 59.9 million for fiscal 2004 to 60.0 million for fiscal 2008. From fiscal 2006 to fiscal 2008,
worldwide annual attendance declined 1.8%. Average revenue per customer, however, has increased over the
same period, largely as a result of Monthly Pass’ growing penetration in NACO. In an effort to provide a greater
degree of insight into the drivers of our business, in fiscal 2007 we introduced a new additional volume metric.
This new metric, “paid weeks”, reports total paid weeks by our customers in Company-owned operations for a
31