WeightWatchers 2008 Annual Report Download - page 56
Download and view the complete annual report
Please find page 56 of the 2008 WeightWatchers annual report below. You can navigate through the pages in the report by either clicking on the pages listed below, or by using the keyword search tool below to find specific information within the annual report.-
 1
1 -
2
-
3
-
4
-
5
-
6
-
7
-
8
-
9
-
10
-
11
-
12
-
13
-
14
-
15
-
16
-
17
-
18
-
19
-
20
-
21
-
22
-
23
-
24
-
25
-
26
-
27
-
28
-
29
-
30
-
31
-
32
-
33
-
34
-
35
-
36
-
37
-
38
-
39
-
40
-
41
-
42
-
43
-
44
-
45
-
 46
46 -
 47
47 -
 48
48 -
 49
49 -
 50
50 -
 51
51 -
 52
52 -
 53
53 -
 54
54 -
 55
55 -
 56
56 -
 57
57 -
 58
58 -
 59
59 -
 60
60 -
 61
61 -
 62
62 -
 63
63 -
 64
64 -
 65
65 -
 66
66 -
67
-
68
-
69
-
70
-
71
-
72
-
73
-
74
-
75
-
76
-
77
-
78
-
79
-
80
-
81
-
82
-
83
-
84
-
85
-
86
-
87
-
88
-
89
-
90
-
91
-
92
-
93
-
94
-
95
-
96
-
97
-
98
-
99
-
100
-
101
-
102
-
103
-
104
-
105
-
106
-
107
-
108
 |
 |
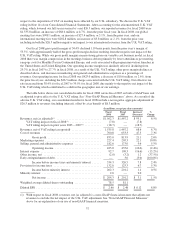
Liquidity and Capital Resources
Balance Sheet
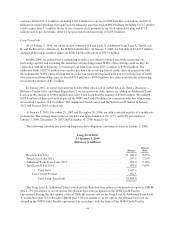
Comparing the balance sheet at January 3, 2009 with that at December 29, 2007, our cash balance increased
by $7.5 million from $39.8 million to $47.3 million. Our working capital deficit at January 3, 2009 was
$270.1 million, including $47.3 million of cash, versus $172.1 million, including $39.8 million of cash, at
December 29, 2007. Excluding the change in cash, the working capital deficit increased by $105.5 million from
December 29, 2007 to January 3, 2009.
Of the $105.5 million increase in negative working capital, $116.9 million reflects an increase in the current
portion of our long-term debt, $19.5 million is due to the net increase in our U.K. VAT liability and $38.0 million
relates to an increase in our derivative payable due to changes in the interest rate yield curve. These are partially
offset by a decrease in negative working capital of $34.5 million arising from higher prepaid and deferred income
taxes and operational items of $34.4 million, largely the result of lower payables and accrued expenses due to
timing of these payments this year versus last year.
Capital spending has averaged approximately $31.5 million annually over the last three fiscal years and has
consisted primarily of information system and website development expenditures, leasehold improvements,
furniture and equipment for meeting locations.
Sources and Uses of Cash
Fiscal 2008
As noted above, at the end of fiscal 2008, cash and cash equivalents were $47.3 million, an increase of $7.5
million from the end of fiscal 2007. Cash flows provided by operating activities were $241.2 million. The cash
provided by operations was driven by our net income of $204.3 million, changes in our working capital, as
described above, and differences between book and cash taxes. Fiscal 2008 cash from operations was negatively
impacted by timing of payments. Certain fiscal 2007 and fiscal 2009 tax and other payments amounting to
approximately $30.0 million were made in fiscal 2008. Investing activities utilized $72.2 million, including $39.7
million for our fiscal 2008 franchise acquisitions and $31.6 million for capital spending. Net cash used for
financing activities totaled $160.1 million. This included the repurchase of 2.8 million shares of our common
stock for $116.0 million and dividend payments of $55.0 million. See Item 5 in Part II of this Annual Report on
Form 10-K for more information regarding our stock repurchase plan.
Fiscal 2007
At the end of fiscal 2007, cash and cash equivalents were $39.8 million, an increase of $2.3 million from the
end of fiscal 2006. Cash flows provided by operating activities were $318.5 million. The cash provided by
operations was driven by our net income of $201.2 million, changes in our working capital and differences
between book and cash taxes. Investing activities utilized $48.8 million, including $16.8 million for our fiscal
2007 franchise acquisitions and $31.8 million for capital spending. Net cash used for financing activities totaled
$269.2 million. This included the repurchase of approximately 19.1 million shares of our common stock for
$1,033.6 million in connection with our Tender Offer and share repurchase from Artal (as further explained in
“Liquidity and Capital Resources—Stock Transactions”) and dividend payments of $58.5 million, financed
primarily by net proceeds from borrowings of $799.0 million.
Fiscal 2006
At the end of fiscal 2006, cash and cash equivalents were $37.5 million, an increase of $6.0 million from the
end of fiscal 2005. Cash flows provided by operating activities were $265.8 million, including $37.0 million
provided by WeightWatchers.com’s operating activities. The cash provided by operations was driven by our net
income of $209.8 million, changes in our working capital and differences between book and cash taxes. Investing
43