U-Haul 2005 Annual Report Download - page 98
Download and view the complete annual report
Please find page 98 of the 2005 U-Haul annual report below. You can navigate through the pages in the report by either clicking on the pages listed below, or by using the keyword search tool below to find specific information within the annual report.-
 1
1 -
2
-
3
-
4
-
5
-
6
-
7
-
8
-
9
-
10
-
11
-
12
-
13
-
14
-
15
-
16
-
17
-
18
-
19
-
20
-
21
-
22
-
23
-
24
-
25
-
26
-
27
-
28
-
29
-
30
-
31
-
32
-
33
-
34
-
35
-
36
-
37
-
38
-
39
-
40
-
41
-
42
-
43
-
44
-
45
-
46
-
47
-
48
-
49
-
50
-
51
-
52
-
53
-
54
-
55
-
56
-
57
-
58
-
59
-
60
-
61
-
62
-
63
-
64
-
65
-
66
-
67
-
68
-
69
-
70
-
71
-
72
-
73
-
74
-
75
-
76
-
77
-
78
-
79
-
80
-
81
-
82
-
83
-
84
-
85
-
86
-
87
-
 88
88 -
 89
89 -
 90
90 -
 91
91 -
 92
92 -
 93
93 -
 94
94 -
 95
95 -
 96
96 -
 97
97 -
 98
98 -
 99
99 -
 100
100 -
 101
101 -
 102
102 -
 103
103
 |
 |

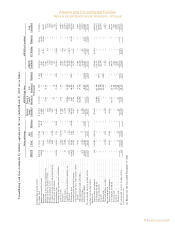
97 I AMERCO ANNUAL REPORT
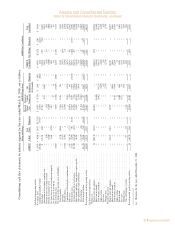
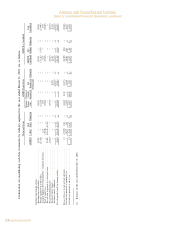
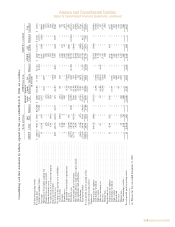
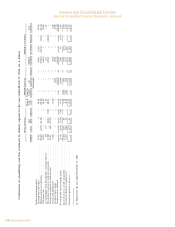
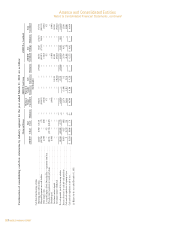
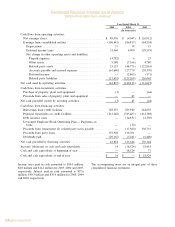
CONDENSED FINANCIAL INFORMATION OF AMERCO
STATEMENTS OF OPERATIONS
Years Ended March 31,
2005 2004 2003
(In thousands, except share and per share data)
Revenues:
Net interest income from subsidiaries ÏÏÏÏÏÏÏÏÏÏÏÏÏÏÏÏÏÏÏ $ 8,348 $ 2,416 $ 1,195
Expenses:
Operating expenses ÏÏÏÏÏÏÏÏÏÏÏÏÏÏÏÏÏÏÏÏÏÏÏÏÏÏÏÏÏÏÏÏÏÏ 18,065 37,080 36,934
Restructuring expenses ÏÏÏÏÏÏÏÏÏÏÏÏÏÏÏÏÏÏÏÏÏÏÏÏÏÏÏÏÏÏÏ Ì 44,097 6,568
Other expenses ÏÏÏÏÏÏÏÏÏÏÏÏÏÏÏÏÏÏÏÏÏÏÏÏÏÏÏÏÏÏÏÏÏÏÏÏÏÏ 121 825 942
Total expenses ÏÏÏÏÏÏÏÏÏÏÏÏÏÏÏÏÏÏÏÏÏÏÏÏÏÏÏÏÏÏÏÏÏÏÏÏ 18,186 82,002 44,444
Equity in earnings of subsidiaries and SAC Holdings ÏÏÏÏÏÏÏÏ 106,441 86,817 44,254
Interest expense ÏÏÏÏÏÏÏÏÏÏÏÏÏÏÏÏÏÏÏÏÏÏÏÏÏÏÏÏÏÏÏÏÏÏÏÏÏÏÏ (70,235) (56,968) (69,213)
Litigation settlement income, net of costsÏÏÏÏÏÏÏÏÏÏÏÏÏÏÏÏÏÏ 51,341 Ì Ì
Pretax earnings (loss) ÏÏÏÏÏÏÏÏÏÏÏÏÏÏÏÏÏÏÏÏÏÏÏÏÏÏÏÏÏÏÏÏÏÏ 77,709 (49,737) (68,208)
Income tax benefitÏÏÏÏÏÏÏÏÏÏÏÏÏÏÏÏÏÏÏÏÏÏÏÏÏÏÏÏÏÏÏÏÏÏÏÏÏ 11,367 45,690 41,296
Net earnings (loss) ÏÏÏÏÏÏÏÏÏÏÏÏÏÏÏÏÏÏÏÏÏÏÏÏÏÏÏÏÏÏÏÏÏÏ 89,076 (4,047) (26,912)
Less: preferred stock dividendsÏÏÏÏÏÏÏÏÏÏÏÏÏÏÏÏÏÏÏÏÏÏÏÏÏÏÏ (12,963) (12,963) (12,963)
Earnings (loss) available to common shareholders ÏÏÏÏÏÏÏÏÏÏ $ 76,113 $ (17,010) $ (39,875)
Earnings (loss) per common share (both basic and diluted): $ 3.66 $ (0.82) $ (1.91)
Weighted average common shares outstanding ÏÏÏÏÏÏÏÏÏÏÏÏÏ 20,804,773 20,749,998 20,824,618
The accompanying notes are an integral part of these consolidated financial statements.
F-56
Theaccompanyingnotesareanintegralpartoftheseconsolidatedfinancialstatements.
Condensed Financial Information of Amerco
Statements of Operations