U-Haul 2005 Annual Report Download - page 34
Download and view the complete annual report
Please find page 34 of the 2005 U-Haul annual report below. You can navigate through the pages in the report by either clicking on the pages listed below, or by using the keyword search tool below to find specific information within the annual report.-
 1
1 -
2
-
3
-
4
-
5
-
6
-
7
-
8
-
9
-
10
-
11
-
12
-
13
-
14
-
15
-
16
-
17
-
18
-
19
-
20
-
21
-
22
-
23
-
 24
24 -
 25
25 -
 26
26 -
 27
27 -
 28
28 -
 29
29 -
 30
30 -
 31
31 -
 32
32 -
 33
33 -
 34
34 -
 35
35 -
 36
36 -
 37
37 -
 38
38 -
 39
39 -
 40
40 -
 41
41 -
 42
42 -
 43
43 -
 44
44 -
45
-
46
-
47
-
48
-
49
-
50
-
51
-
52
-
53
-
54
-
55
-
56
-
57
-
58
-
59
-
60
-
61
-
62
-
63
-
64
-
65
-
66
-
67
-
68
-
69
-
70
-
71
-
72
-
73
-
74
-
75
-
76
-
77
-
78
-
79
-
80
-
81
-
82
-
83
-
84
-
85
-
86
-
87
-
88
-
89
-
90
-
91
-
92
-
93
-
94
-
95
-
96
-
97
-
98
-
99
-
100
-
101
-
102
-
103
 |
 |

33 I AMERCO ANNUAL REPORT
Management’s Discussion and Analysis
of Financial Condition and Results of Operations
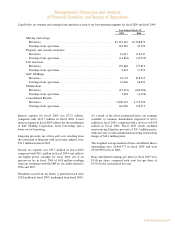
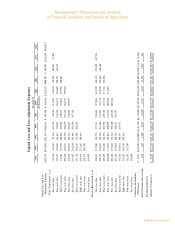
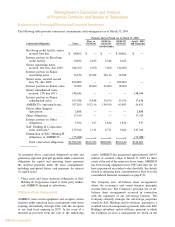
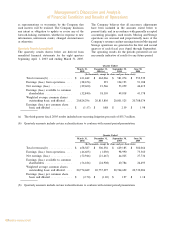
The following table illustrates the change in unpaid loss and loss adjustment expenses. The first line
represents reserves as originally reported at the end of the stated year. The second section, reading down,
represents cumulative amounts paid as of the end of successive years with respect to that reserve. The third
section, reading down, represents revised estimates of the original recorded reserve as of the end of successive
years. The last section compares the latest revised estimated reserve amount to the reserve amount as
originally established. This last section is cumulative and should not be summed.
Unpaid Loss and Loss Adjustment Expenses
December 31
1994 1995 1996 1997 1998 1999 2000 2001 2002 2003 2004
(In thousands)
Unpaid Loss and Loss
Adjustment ExpensesÏÏÏÏÏÏÏ $329,741 $341,981 $332,674 $384,816 $ 344,748 $ 334,858 $ 382,651 $448,987 $ 399,447 $416,259 $380,875
Paid (Cumulative) as of:
One year laterÏÏÏÏÏÏÏÏÏÏÏ 86,796 89,041 89,336 103,752 82,936 117,025 130,471 130,070 100,851 73,384
Two years later ÏÏÏÏÏÏÏÏÏÏ 139,247 150,001 161,613 174,867 164,318 186,193 203,605 209,525 164,255
Three years laterÏÏÏÏÏÏÏÏÏ 173,787 195,855 208,168 216,966 218,819 232,883 255,996 266,483
Four years later ÏÏÏÏÏÏÏÏÏ 198,434 226,815 232,726 246,819 255,134 264,517 299,681
Five years later ÏÏÏÏÏÏÏÏÏÏ 219,425 243,855 250,312 269,425 274,819 295,997
Six years laterÏÏÏÏÏÏÏÏÏÏÏ 231,447 254,204 263,645 282,598 297,354
Seven years later ÏÏÏÏÏÏÏÏ 237,118 264,120 274,249 300,814
Eight years later ÏÏÏÏÏÏÏÏÏ 242,450 273,205 289,614
Nine years later ÏÏÏÏÏÏÏÏÏ 250,475 286,708
Ten years later ÏÏÏÏÏÏÏÏÏÏ 263,095
Reserve Reestimated as of:
One year laterÏÏÏÏÏÏÏÏÏÏÏ 338,033 353,508 354,776 357,733 339,602 377,096 433,222 454,510 471,029 447,524
Two years later ÏÏÏÏÏÏÏÏÏÏ 340,732 369,852 342,164 361,306 371,431 432,714 454,926 523,624 508,180
Three years laterÏÏÏÏÏÏÏÏÏ 349,459 328,445 346,578 369,598 429,160 437,712 517,361 545,836
Four years later ÏÏÏÏÏÏÏÏÏ 302,808 331,897 349,810 398,899 413,476 480,200 533,067
Five years later ÏÏÏÏÏÏÏÏÏÏ 300,180 339,665 376,142 398,184 443,696 489,384
Six years laterÏÏÏÏÏÏÏÏÏÏÏ 307,306 347,664 369,320 428,031 456,797
Seven years later ÏÏÏÏÏÏÏÏ 332,762 344,451 396,197 435,972
Eight years later ÏÏÏÏÏÏÏÏÏ 311,682 360,149 397,363
Nine years later ÏÏÏÏÏÏÏÏÏ 323,241 362,369
Ten years later ÏÏÏÏÏÏÏÏÏÏ 325,690
Cumulative Redundancy
(Deficiency) ÏÏÏÏÏÏÏÏÏÏÏÏÏÏ $ 4,051 $(20,388) $(64,689) $(51,156) $(112,049) $(154,526) $(150,416) $(96,849) $(108,733) $(31,265)
Retro Premium RecoverableÏÏÏ 878 623 1,582 3,037 (1,879) 6,797 5,613 21,756 7,036 374
Reestimated Reserve:
Amount (Cumulative)ÏÏÏÏÏÏÏÏ $ 4,929 $(19,765) $(63,107) $(48,119) $(113,928) $(147,729) $(144,803) $(75,093) $(101,697) $(30,891)
26