U-Haul 2005 Annual Report Download - page 79
Download and view the complete annual report
Please find page 79 of the 2005 U-Haul annual report below. You can navigate through the pages in the report by either clicking on the pages listed below, or by using the keyword search tool below to find specific information within the annual report.-
 1
1 -
2
-
3
-
4
-
5
-
6
-
7
-
8
-
9
-
10
-
11
-
12
-
13
-
14
-
15
-
16
-
17
-
18
-
19
-
20
-
21
-
22
-
23
-
24
-
25
-
26
-
27
-
28
-
29
-
30
-
31
-
32
-
33
-
34
-
35
-
36
-
37
-
38
-
39
-
40
-
41
-
42
-
43
-
44
-
45
-
46
-
47
-
48
-
49
-
50
-
51
-
52
-
53
-
54
-
55
-
56
-
57
-
58
-
59
-
60
-
61
-
62
-
63
-
64
-
65
-
66
-
67
-
68
-
 69
69 -
 70
70 -
 71
71 -
 72
72 -
 73
73 -
 74
74 -
 75
75 -
 76
76 -
 77
77 -
 78
78 -
 79
79 -
 80
80 -
 81
81 -
 82
82 -
 83
83 -
 84
84 -
 85
85 -
 86
86 -
 87
87 -
 88
88 -
 89
89 -
90
-
91
-
92
-
93
-
94
-
95
-
96
-
97
-
98
-
99
-
100
-
101
-
102
-
103
 |
 |

78 I AMERCO ANNUAL REPORT
Amerco and Consolidated Entities
Notes to Consolidated Financial Statements, continued
OnMay20,2003,RepWestconsentedtoanOrderforSupervisionissuedbytheStateofArizonaDepartmentofInsurance
(“DOI”).TheDOIdeterminedthatRepWest’slevelofriskbasedcapital(“RBC”)allowedforregulatorycontrol.Pursuant
tothisorderandArizonalaw,duringtheperiodofsupervision,RepWestcouldnotengageincertainactivitieswithoutthe
priorapprovaloftheDOI.TheorderwasabatedonJune9,2005.
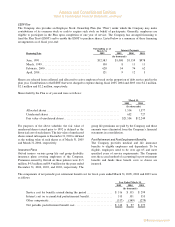
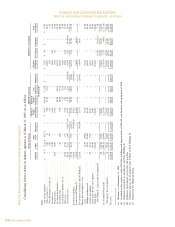
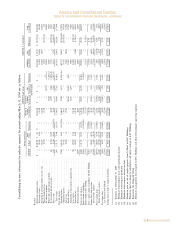
Note 21: Financial Information by Geographic Area
Financialinformationbygeographicareaforfiscalyear2005isasfollows:
AMERCO AND CONSOLIDATED ENTITIES
NOTES TO CONSOLIDATED FINANCIAL STATEMENTS Ì (Continued)
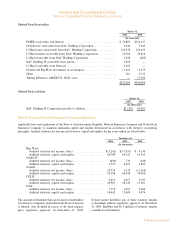
The amount of dividends that can be paid to shareholders by insurance companies domiciled in the State
of Arizona is limited. Any dividend in excess of the limit requires prior regulatory approval. At December 31,
2004, Oxford cannot distribute any of their statutory surplus as dividends without regulatory approval. At
December 31, 2004, RepWest had $6.5 million of statutory surplus available for distribution.
On May 20, 2003, RepWest consented to an Order for Supervision issued by the State of Arizona
Department of Insurance (""DOI''). The DOI determined that RepWest's level of risk based capital (""RBC'')
allowed for regulatory control. Pursuant to this order and Arizona law, during the period of supervision,
RepWest could not engage in certain activities without the prior approval of the DOI. The order was abated on
June 9, 2005.
Note 21: Financial Information by Geographic Area
Financial information by geographic area for fiscal year 2005 is as follows:
Year Ended United States Canada Consolidated
(All amounts are in thousands U.S. $'s)
March 31, 2005
Total revenues ÏÏÏÏÏÏÏÏÏÏÏÏÏÏÏÏÏÏÏÏÏÏÏÏÏÏÏÏÏÏÏÏÏÏÏÏÏ $1,956,719 $51,402 $2,008,121
Depreciation and amortization, net ÏÏÏÏÏÏÏÏÏÏÏÏÏÏÏÏÏÏÏÏ 145,167 4,448 149,615
Interest (expense) income ÏÏÏÏÏÏÏÏÏÏÏÏÏÏÏÏÏÏÏÏÏÏÏÏÏÏÏ (73,231) 26 (73,205)
Pretax earnings ÏÏÏÏÏÏÏÏÏÏÏÏÏÏÏÏÏÏÏÏÏÏÏÏÏÏÏÏÏÏÏÏÏÏÏÏÏ 143,840 1,292 145,132
Income tax expense ÏÏÏÏÏÏÏÏÏÏÏÏÏÏÏÏÏÏÏÏÏÏÏÏÏÏÏÏÏÏÏÏÏ 55,708 Ì 55,708
Identifiable assetsÏÏÏÏÏÏÏÏÏÏÏÏÏÏÏÏÏÏÏÏÏÏÏÏÏÏÏÏÏÏÏÏÏÏÏ 3,031,461 72,161 3,103,622
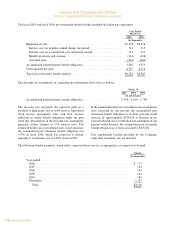
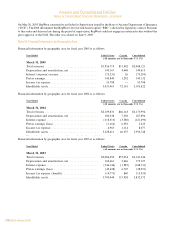
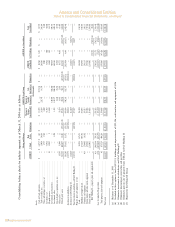
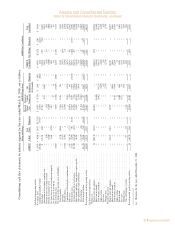
Financial information by geographic area for fiscal year 2004 is as follows:
Year Ended United States Canada Consolidated
(All amounts are in thousands U.S. $'s)
March 31, 2004
Total revenues ÏÏÏÏÏÏÏÏÏÏÏÏÏÏÏÏÏÏÏÏÏÏÏÏÏÏÏÏÏÏÏÏÏÏÏÏÏ $2,109,831 $66,163 $2,175,994
Depreciation and amortization, net ÏÏÏÏÏÏÏÏÏÏÏÏÏÏÏÏÏÏÏÏ 180,538 7,358 187,896
Interest expense ÏÏÏÏÏÏÏÏÏÏÏÏÏÏÏÏÏÏÏÏÏÏÏÏÏÏÏÏÏÏÏÏÏÏÏÏ (118,310) (3,380) (121,690)
Pretax earnings (loss) ÏÏÏÏÏÏÏÏÏÏÏÏÏÏÏÏÏÏÏÏÏÏÏÏÏÏÏÏÏÏÏ (1,166) 6,391 5,225
Income tax expense ÏÏÏÏÏÏÏÏÏÏÏÏÏÏÏÏÏÏÏÏÏÏÏÏÏÏÏÏÏÏÏÏÏ 6,963 1,114 8,077
Identifiable assetsÏÏÏÏÏÏÏÏÏÏÏÏÏÏÏÏÏÏÏÏÏÏÏÏÏÏÏÏÏÏÏÏÏÏÏ 3,328,411 66,337 3,394,748
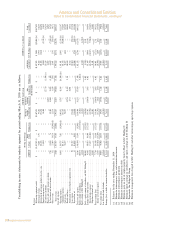
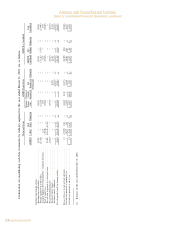
Financial information by geographic area for fiscal year 2003 is as follows:
Year Ended United States Canada Consolidated
(All amounts are in thousands U.S. $'s)
March 31, 2003
Total revenues ÏÏÏÏÏÏÏÏÏÏÏÏÏÏÏÏÏÏÏÏÏÏÏÏÏÏÏÏÏÏÏÏÏÏÏÏÏ $2,086,290 $55,054 $2,141,344
Depreciation and amortization, net ÏÏÏÏÏÏÏÏÏÏÏÏÏÏÏÏÏÏÏÏ 169,661 5,466 175,127
Interest expense ÏÏÏÏÏÏÏÏÏÏÏÏÏÏÏÏÏÏÏÏÏÏÏÏÏÏÏÏÏÏÏÏÏÏÏÏ (146,144) (1,987) (148,131)
Pretax earnings (loss) ÏÏÏÏÏÏÏÏÏÏÏÏÏÏÏÏÏÏÏÏÏÏÏÏÏÏÏÏÏÏÏ (45,628) 6,707 (38,921)
Income tax expense (benefit)ÏÏÏÏÏÏÏÏÏÏÏÏÏÏÏÏÏÏÏÏÏÏÏÏÏ (14,775) 840 (13,935)
Identifiable assetsÏÏÏÏÏÏÏÏÏÏÏÏÏÏÏÏÏÏÏÏÏÏÏÏÏÏÏÏÏÏÏÏÏÏÏ 3,700,444 131,928 3,832,372
F-37
AMERCO AND CONSOLIDATED ENTITIES
NOTES TO CONSOLIDATED FINANCIAL STATEMENTS Ì (Continued)
The amount of dividends that can be paid to shareholders by insurance companies domiciled in the State
of Arizona is limited. Any dividend in excess of the limit requires prior regulatory approval. At December 31,
2004, Oxford cannot distribute any of their statutory surplus as dividends without regulatory approval. At
December 31, 2004, RepWest had $6.5 million of statutory surplus available for distribution.
On May 20, 2003, RepWest consented to an Order for Supervision issued by the State of Arizona
Department of Insurance (""DOI''). The DOI determined that RepWest's level of risk based capital (""RBC'')
allowed for regulatory control. Pursuant to this order and Arizona law, during the period of supervision,
RepWest could not engage in certain activities without the prior approval of the DOI. The order was abated on
June 9, 2005.
Note 21: Financial Information by Geographic Area
Financial information by geographic area for fiscal year 2005 is as follows:
Year Ended United States Canada Consolidated
(All amounts are in thousands U.S. $'s)
March 31, 2005
Total revenues ÏÏÏÏÏÏÏÏÏÏÏÏÏÏÏÏÏÏÏÏÏÏÏÏÏÏÏÏÏÏÏÏÏÏÏÏÏ $1,956,719 $51,402 $2,008,121
Depreciation and amortization, net ÏÏÏÏÏÏÏÏÏÏÏÏÏÏÏÏÏÏÏÏ 145,167 4,448 149,615
Interest (expense) income ÏÏÏÏÏÏÏÏÏÏÏÏÏÏÏÏÏÏÏÏÏÏÏÏÏÏÏ (73,231) 26 (73,205)
Pretax earnings ÏÏÏÏÏÏÏÏÏÏÏÏÏÏÏÏÏÏÏÏÏÏÏÏÏÏÏÏÏÏÏÏÏÏÏÏÏ 143,840 1,292 145,132
Income tax expense ÏÏÏÏÏÏÏÏÏÏÏÏÏÏÏÏÏÏÏÏÏÏÏÏÏÏÏÏÏÏÏÏÏ 55,708 Ì 55,708
Identifiable assetsÏÏÏÏÏÏÏÏÏÏÏÏÏÏÏÏÏÏÏÏÏÏÏÏÏÏÏÏÏÏÏÏÏÏÏ 3,031,461 72,161 3,103,622
Financial information by geographic area for fiscal year 2004 is as follows:
Year Ended United States Canada Consolidated
(All amounts are in thousands U.S. $'s)
March 31, 2004
Total revenues ÏÏÏÏÏÏÏÏÏÏÏÏÏÏÏÏÏÏÏÏÏÏÏÏÏÏÏÏÏÏÏÏÏÏÏÏÏ $2,109,831 $66,163 $2,175,994
Depreciation and amortization, net ÏÏÏÏÏÏÏÏÏÏÏÏÏÏÏÏÏÏÏÏ 180,538 7,358 187,896
Interest expense ÏÏÏÏÏÏÏÏÏÏÏÏÏÏÏÏÏÏÏÏÏÏÏÏÏÏÏÏÏÏÏÏÏÏÏÏ (118,310) (3,380) (121,690)
Pretax earnings (loss) ÏÏÏÏÏÏÏÏÏÏÏÏÏÏÏÏÏÏÏÏÏÏÏÏÏÏÏÏÏÏÏ (1,166) 6,391 5,225
Income tax expense ÏÏÏÏÏÏÏÏÏÏÏÏÏÏÏÏÏÏÏÏÏÏÏÏÏÏÏÏÏÏÏÏÏ 6,963 1,114 8,077
Identifiable assetsÏÏÏÏÏÏÏÏÏÏÏÏÏÏÏÏÏÏÏÏÏÏÏÏÏÏÏÏÏÏÏÏÏÏÏ 3,328,411 66,337 3,394,748
Financial information by geographic area for fiscal year 2003 is as follows:
Year Ended United States Canada Consolidated
(All amounts are in thousands U.S. $'s)
March 31, 2003
Total revenues ÏÏÏÏÏÏÏÏÏÏÏÏÏÏÏÏÏÏÏÏÏÏÏÏÏÏÏÏÏÏÏÏÏÏÏÏÏ $2,086,290 $55,054 $2,141,344
Depreciation and amortization, net ÏÏÏÏÏÏÏÏÏÏÏÏÏÏÏÏÏÏÏÏ 169,661 5,466 175,127
Interest expense ÏÏÏÏÏÏÏÏÏÏÏÏÏÏÏÏÏÏÏÏÏÏÏÏÏÏÏÏÏÏÏÏÏÏÏÏ (146,144) (1,987) (148,131)
Pretax earnings (loss) ÏÏÏÏÏÏÏÏÏÏÏÏÏÏÏÏÏÏÏÏÏÏÏÏÏÏÏÏÏÏÏ (45,628) 6,707 (38,921)
Income tax expense (benefit)ÏÏÏÏÏÏÏÏÏÏÏÏÏÏÏÏÏÏÏÏÏÏÏÏÏ (14,775) 840 (13,935)
Identifiable assetsÏÏÏÏÏÏÏÏÏÏÏÏÏÏÏÏÏÏÏÏÏÏÏÏÏÏÏÏÏÏÏÏÏÏÏ 3,700,444 131,928 3,832,372
F-37
Financialinformationbygeographicareaforfiscalyear2004isasfollows:
Financialinformationbygeographicareaforfiscalyear2003isasfollows: