U-Haul 2005 Annual Report Download - page 38
Download and view the complete annual report
Please find page 38 of the 2005 U-Haul annual report below. You can navigate through the pages in the report by either clicking on the pages listed below, or by using the keyword search tool below to find specific information within the annual report.-
 1
1 -
2
-
3
-
4
-
5
-
6
-
7
-
8
-
9
-
10
-
11
-
12
-
13
-
14
-
15
-
16
-
17
-
18
-
19
-
20
-
21
-
22
-
23
-
24
-
25
-
26
-
27
-
 28
28 -
 29
29 -
 30
30 -
 31
31 -
 32
32 -
 33
33 -
 34
34 -
 35
35 -
 36
36 -
 37
37 -
 38
38 -
 39
39 -
 40
40 -
 41
41 -
 42
42 -
 43
43 -
 44
44 -
 45
45 -
 46
46 -
 47
47 -
 48
48 -
49
-
50
-
51
-
52
-
53
-
54
-
55
-
56
-
57
-
58
-
59
-
60
-
61
-
62
-
63
-
64
-
65
-
66
-
67
-
68
-
69
-
70
-
71
-
72
-
73
-
74
-
75
-
76
-
77
-
78
-
79
-
80
-
81
-
82
-
83
-
84
-
85
-
86
-
87
-
88
-
89
-
90
-
91
-
92
-
93
-
94
-
95
-
96
-
97
-
98
-
99
-
100
-
101
-
102
-
103
 |
 |

37 I AMERCO ANNUAL REPORT
Management’s Discussion and Analysis
of Financial Condition and Results of Operations
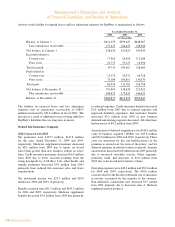
LiquidityandCapitalResources
Our financial condition remains strong. At March 31,
2005, cash and short-term investments totaled $56.0
million,comparedwith$81.6millionatMarch31,2004.
Total short-term and long-term debt, plus capital lease
obligations were $780.0 million at March 31, 2005,
compared with $962.3 million at March 31, 2004, and
represented1.4times stockholders’ equity at March 31,
2005, compared with 1.9 times stockholders’ equity at
March31,2004.
During March 2004, SAC Holding Corporation ceased to be a variable interest entity and AMERCO
ceased being the primary beneficiary of SAC Holding Corporation. As a result of this, AMERCO
deconsolidated its interests in SAC Holding Corporation at that time. AMERCO remains the primary
beneficiary of its contractual variable interests in SAC Holding II Corporation for fiscal 2005 and 2004.
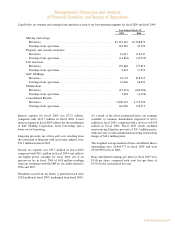
Revenues for fiscal 2005 fell $175.8 million, primarily as a result of the above mentioned deconsolidation.
Total costs and expenses were $32.7 million in fiscal 2005, compared with $154.3 million in fiscal 2004.
Total costs and expenses fell $121.6 million, primarily as a result of the above mentioned deconsolidation.
Earnings from operations were $10.5 million in fiscal 2005 compared with $64.7 million in fiscal 2004.
Earnings from operations fell $54.2 million in fiscal 2005 compared with fiscal 2004, primarily as a result of
the above mentioned deconsolidation.
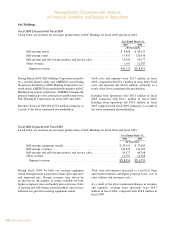
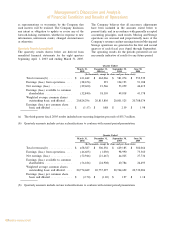
Fiscal 2004 Compared with Fiscal 2003
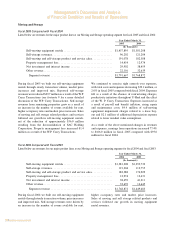
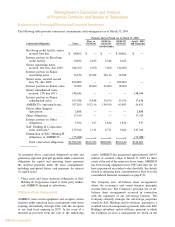
Listed below are revenues for our major product lines at SAC Holdings for fiscal 2004 and fiscal 2003:
Year Ended March 31,
2004 2003
(In thousands)
Self-moving equipment rentals ÏÏÏÏÏÏÏÏÏÏÏÏÏÏÏÏÏÏÏÏÏÏÏÏÏÏÏÏÏÏÏÏÏÏÏÏÏ $ 29,155 $ 27,680
Self-storage revenues ÏÏÏÏÏÏÏÏÏÏÏÏÏÏÏÏÏÏÏÏÏÏÏÏÏÏÏÏÏÏÏÏÏÏÏÏÏÏÏÏÏÏÏÏÏ 126,436 126,183
Self-moving and self-storage product and service sales ÏÏÏÏÏÏÏÏÏÏÏÏÏÏÏÏÏ 50,577 48,768
Other revenueÏÏÏÏÏÏÏÏÏÏÏÏÏÏÏÏÏÏÏÏÏÏÏÏÏÏÏÏÏÏÏÏÏÏÏÏÏÏÏÏÏÏÏÏÏÏÏÏÏÏÏ 12,787 14,164
Segment revenue ÏÏÏÏÏÏÏÏÏÏÏÏÏÏÏÏÏÏÏÏÏÏÏÏÏÏÏÏÏÏÏÏÏÏÏÏÏÏÏÏÏÏÏÏÏÏ $218,955 $216,795
During fiscal 2004 we built our moving equipment rentals through steady transaction volume, price
increases and improved mix. Storage revenues were driven by an increase in the number of rooms available for
rent, higher occupancy rates and modest price increases. Sales of moving and self-storage related products and
services followed our growth in moving equipment rentals.
Total costs and expenses increased as a result of wage and benefit inflation and higher property taxes, cost
of sales, utilities and insurance costs.
As a result of the above mentioned changes in revenues and expenses, earnings from operations were
$64.7 million in fiscal 2004, compared with $68.8 million in fiscal 2003.
Liquidity and Capital Resources
Our financial condition remains strong. At March 31, 2005, cash and short-term investments totaled
$56.0 million, compared with $81.6 million at March 31, 2004. Total short-term and long-term debt, plus
capital lease obligations were $780.0 million at March 31, 2005, compared with $962.3 million at March 31,
2004, and represented 1.4 times stockholders' equity at March 31, 2005, compared with 1.9 times
stockholders' equity at March 31, 2004.
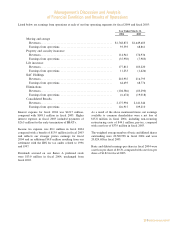
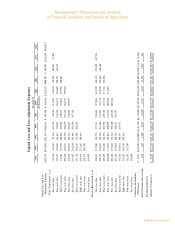
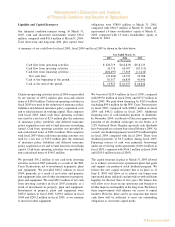
A summary of our cash flows for fiscal 2005, fiscal 2004 and fiscal 2003 is shown in the table below:
Year Ended March 31,
2005 2004 2003
(In thousands)
Cash flow from operating activitiesÏÏÏÏÏÏÏÏÏÏÏÏÏÏÏÏÏÏÏÏÏÏ $ 220,719 $(62,833) $118,133
Cash flow from investing activities ÏÏÏÏÏÏÏÏÏÏÏÏÏÏÏÏÏÏÏÏÏÏ 36,176 60,187 (81,113)
Cash flow from financing activitiesÏÏÏÏÏÏÏÏÏÏÏÏÏÏÏÏÏÏÏÏÏÏ (282,497) 17,369 (11,632)
Net cash flow ÏÏÏÏÏÏÏÏÏÏÏÏÏÏÏÏÏÏÏÏÏÏÏÏÏÏÏÏÏÏÏÏÏÏÏÏÏ (25,602) 14,723 25,388
Cash at the beginning of the period ÏÏÏÏÏÏÏÏÏÏÏÏÏÏÏÏÏÏÏÏÏ 81,557 66,834 41,446
Cash at the end of the period ÏÏÏÏÏÏÏÏÏÏÏÏÏÏÏÏÏÏÏÏÏÏÏÏÏÏ $ 55,955 $ 81,557 $ 66,834
29
Asummaryofourcashflowsforfiscal2005,fiscal2004andfiscal2003isshowninthetablebelow:
Cashfromoperatingactivitiesinfiscal2005wasprovided
by net income of $89.4 million plus non-cash related
itemsof$209.8million.Cashfromoperatingactivitiesin
fiscal2005wasusedinthereductionofinsurancepolicy
liabilitiesanddeferredinsurancepolicyacquisitioncosts
andtofundincreasesinworkingcapital.Thiscompares
with fiscal 2004 when cash from operating activities
wasusedbyanetlossof$2.9millionplusthereduction
of insurance policy liabilities and deferred insurance
policyacquisitioncostsandtofundincreasesinworking
capital. Cashfrom operatingactivitieswasprovidedby
non-cashrelateditemsof$281.4million.Thiscompares
withfiscal2003whencashfromoperatingactivitieswas
used by a net loss of $25.0 million plus the reduction
of insurance policy liabilities and deferred insurance
policyacquisitioncostsandtofundincreasesinworking
capital. Cashfrom operatingactivitieswasprovidedby
non-cashrelateditemsof$149.2million.
We provided $36.2 million of net cash from investing
activitiesinfiscal2005primarilyasaresultoftheW.P.
CareyTransactions,netofinvestmentsinproperty,plant
and equipment. We provided $60.2 million in fiscal
2004, primarily as a result of real estate and property
andequipmentsales,netofotherinvestmentsinproperty,
plantandequipment.Weused$81.1millionofnetcash
from investing activities in fiscal 2003, primarily as a
result of investments in property, plant and equipment.
Investments in property, plant and equipment were
$285.0 million in fiscal 2005, $198.4 million in fiscal
2004and$243.2millioninfiscal2003,aswecontinue
toinvestinrentalequipment.
We borrowed $129.4 million in fiscal 2005, compared
with$997.0millioninfiscal2004,and$371.7millionin
fiscal2003.Wepaiddownfinancingby$313.0million
(including$99.6millionfortheW.P.CareyTransactions)
in fiscal 2005, compared with $888.2 million in fiscal
2004 and $442.1 million in fiscal 2003. Additional
financing uses of cash included payment of dividends.
InNovember2004,ourBoardofDirectorsapprovedthe
payment of all dividend arrearages on our Series A 8
1/2%PreferredStock.Regularquarterlycashdividends
havebeenpaidonacurrentbasissinceFebruary2004.As
aresult,ourdividendpaymentswere$25.9millionhigher
in fiscal 2005 compared with fiscal 2004. There were
dividend payments of $6.5 million during fiscal 2003.
Financing sources of cash were primarily borrowings
underourrevolvingcreditagreements($129.4millionin
fiscal2005,comparedwith$164.1millioninfiscal2004
and$205.0millioninfiscal2003).
ThecapitalstructureinplaceatMarch31,2005allowed
usto achieve ournear-termoperationalplansandgoals
and support our preferred stock dividend program. We
believe the new capital structure that is in place as of
June 8, 2005 will allow us to achieve our longer-term
operationalplansandgoalsandprovideuswithsufficient
liquidityforthenextthreetofiveyears.Webelievethis
willallowustofocusonouroperationsandbusinessto
furtherimproveourliquidityinthelong-term.Webelieve
these improvements will enhance our access to capital
markets.However,therecanbenoassurancethatfuture
cash flows will be sufficient to meet our outstanding
obligationsorourfuturecapitalneeds.