U-Haul 2005 Annual Report Download - page 50
Download and view the complete annual report
Please find page 50 of the 2005 U-Haul annual report below. You can navigate through the pages in the report by either clicking on the pages listed below, or by using the keyword search tool below to find specific information within the annual report.-
 1
1 -
2
-
3
-
4
-
5
-
6
-
7
-
8
-
9
-
10
-
11
-
12
-
13
-
14
-
15
-
16
-
17
-
18
-
19
-
20
-
21
-
22
-
23
-
24
-
25
-
26
-
27
-
28
-
29
-
30
-
31
-
32
-
33
-
34
-
35
-
36
-
37
-
38
-
39
-
 40
40 -
 41
41 -
 42
42 -
 43
43 -
 44
44 -
 45
45 -
 46
46 -
 47
47 -
 48
48 -
 49
49 -
 50
50 -
 51
51 -
 52
52 -
 53
53 -
 54
54 -
 55
55 -
 56
56 -
 57
57 -
 58
58 -
 59
59 -
 60
60 -
61
-
62
-
63
-
64
-
65
-
66
-
67
-
68
-
69
-
70
-
71
-
72
-
73
-
74
-
75
-
76
-
77
-
78
-
79
-
80
-
81
-
82
-
83
-
84
-
85
-
86
-
87
-
88
-
89
-
90
-
91
-
92
-
93
-
94
-
95
-
96
-
97
-
98
-
99
-
100
-
101
-
102
-
103
 |
 |

49 I AMERCO ANNUAL REPORT
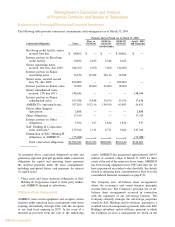
Amerco and Consolidated Entities
Consolidated Statements of Operations
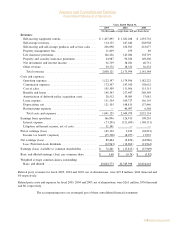
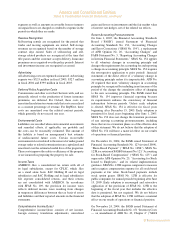
Relatedpartyrevenuesforfiscal2005,2004and2003,netofeliminations,were$25.8million,$184thousandand
$0respectively.
Relatedpartycostsandexpensesforfiscal2005,2004and2003,netofeliminations,were$26.1million,$336thousand
and$0,respectively.
Theaccompanyingnotesareanintegralpartoftheseconsolidatedfinancialstatements.
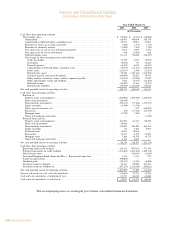
AMERCO AND CONSOLIDATED ENTITIES
CONSOLIDATED STATEMENTS OF OPERATIONS
Years Ended March 31,
2005 2004 2003
(In thousands, except share and per share data)
Revenues:
Self-moving equipment rentals ÏÏÏÏÏÏÏÏÏÏÏÏÏÏÏÏÏÏÏÏÏÏÏÏÏ $ 1,437,895 $ 1,381,208 $ 1,293,732
Self-storage revenues ÏÏÏÏÏÏÏÏÏÏÏÏÏÏÏÏÏÏÏÏÏÏÏÏÏÏÏÏÏÏÏÏÏ 114,155 247,640 238,938
Self-moving and self-storage products and service sales ÏÏÏÏ 206,098 232,965 223,677
Property management fees ÏÏÏÏÏÏÏÏÏÏÏÏÏÏÏÏÏÏÏÏÏÏÏÏÏÏÏÏ 11,839 259 89
Life insurance premiumsÏÏÏÏÏÏÏÏÏÏÏÏÏÏÏÏÏÏÏÏÏÏÏÏÏÏÏÏÏÏ 126,236 145,082 158,719
Property and casualty insurance premiums ÏÏÏÏÏÏÏÏÏÏÏÏÏÏÏ 24,987 92,036 149,206
Net investment and interest income ÏÏÏÏÏÏÏÏÏÏÏÏÏÏÏÏÏÏÏÏ 56,739 38,281 40,731
Other revenueÏÏÏÏÏÏÏÏÏÏÏÏÏÏÏÏÏÏÏÏÏÏÏÏÏÏÏÏÏÏÏÏÏÏÏÏÏÏÏ 30,172 38,523 36,252
Total revenues ÏÏÏÏÏÏÏÏÏÏÏÏÏÏÏÏÏÏÏÏÏÏÏÏÏÏÏÏÏÏÏÏÏÏÏÏ 2,008,121 2,175,994 2,141,344
Costs and expenses:
Operating expenses ÏÏÏÏÏÏÏÏÏÏÏÏÏÏÏÏÏÏÏÏÏÏÏÏÏÏÏÏÏÏÏÏÏÏ 1,122,197 1,179,996 1,182,222
Commission expenses ÏÏÏÏÏÏÏÏÏÏÏÏÏÏÏÏÏÏÏÏÏÏÏÏÏÏÏÏÏÏÏÏ 172,307 147,010 138,652
Cost of sales ÏÏÏÏÏÏÏÏÏÏÏÏÏÏÏÏÏÏÏÏÏÏÏÏÏÏÏÏÏÏÏÏÏÏÏÏÏÏÏÏ 105,309 111,906 115,115
Benefits and losses ÏÏÏÏÏÏÏÏÏÏÏÏÏÏÏÏÏÏÏÏÏÏÏÏÏÏÏÏÏÏÏÏÏÏÏ 140,343 217,447 248,349
Amortization of deferred policy acquisition costsÏÏÏÏÏÏÏÏÏÏ 28,512 39,083 37,681
Lease expenseÏÏÏÏÏÏÏÏÏÏÏÏÏÏÏÏÏÏÏÏÏÏÏÏÏÏÏÏÏÏÏÏÏÏÏÏÏÏÏ 151,354 160,727 166,101
Depreciation, net ÏÏÏÏÏÏÏÏÏÏÏÏÏÏÏÏÏÏÏÏÏÏÏÏÏÏÏÏÏÏÏÏÏÏÏÏ 121,103 148,813 137,446
Restructuring expenses ÏÏÏÏÏÏÏÏÏÏÏÏÏÏÏÏÏÏÏÏÏÏÏÏÏÏÏÏÏÏÏ Ì 44,097 6,568
Total costs and expenses ÏÏÏÏÏÏÏÏÏÏÏÏÏÏÏÏÏÏÏÏÏÏÏÏÏÏÏÏ 1,841,125 2,049,079 2,032,134
Earnings from operations ÏÏÏÏÏÏÏÏÏÏÏÏÏÏÏÏÏÏÏÏÏÏÏÏÏÏÏÏÏÏÏ 166,996 126,915 109,210
Interest expense ÏÏÏÏÏÏÏÏÏÏÏÏÏÏÏÏÏÏÏÏÏÏÏÏÏÏÏÏÏÏÏÏÏÏÏÏÏ (73,205) (121,690) (148,131)
Litigation settlement income, net of costsÏÏÏÏÏÏÏÏÏÏÏÏÏÏÏÏ 51,341 Ì Ì
Pretax earnings (loss) ÏÏÏÏÏÏÏÏÏÏÏÏÏÏÏÏÏÏÏÏÏÏÏÏÏÏÏÏÏÏÏÏÏÏ 145,132 5,225 (38,921)
Income tax benefit (expense) ÏÏÏÏÏÏÏÏÏÏÏÏÏÏÏÏÏÏÏÏÏÏÏÏÏ (55,708) (8,077) 13,935
Net earnings (loss) ÏÏÏÏÏÏÏÏÏÏÏÏÏÏÏÏÏÏÏÏÏÏÏÏÏÏÏÏÏÏÏÏÏÏÏÏ 89,424 (2,852) (24,986)
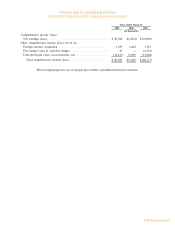
Less: Preferred stock dividends ÏÏÏÏÏÏÏÏÏÏÏÏÏÏÏÏÏÏÏÏÏÏÏÏ (12,963) (12,963) (12,963)
Earnings (loss) available to common shareholders ÏÏÏÏÏÏÏÏÏÏ $ 76,461 $ (15,815) $ (37,949)
Basic and diluted earnings (loss) per common share ÏÏÏÏÏÏÏÏ $ 3.68 $ (0.76) $ (1.82)
Weighted average common shares outstanding:
Basic and diluted ÏÏÏÏÏÏÏÏÏÏÏÏÏÏÏÏÏÏÏÏÏÏÏÏÏÏÏÏÏÏÏÏÏÏÏÏ 20,804,773 20,749,998 20,824,618
Related party revenues for fiscal 2005, 2004 and 2003, net of eliminations, were $25.8 million, $184
thousand and $0 respectively.
Related party costs and expenses for fiscal 2005, 2004 and 2003, net of eliminations, were $26.1 million,
$336 thousand and $0, respectively.
The accompanying notes are an integral part of these consolidated financial statements.
F-4