U-Haul 2005 Annual Report Download - page 30
Download and view the complete annual report
Please find page 30 of the 2005 U-Haul annual report below. You can navigate through the pages in the report by either clicking on the pages listed below, or by using the keyword search tool below to find specific information within the annual report.-
 1
1 -
2
-
3
-
4
-
5
-
6
-
7
-
8
-
9
-
10
-
11
-
12
-
13
-
14
-
15
-
16
-
17
-
18
-
19
-
 20
20 -
 21
21 -
 22
22 -
 23
23 -
 24
24 -
 25
25 -
 26
26 -
 27
27 -
 28
28 -
 29
29 -
 30
30 -
 31
31 -
 32
32 -
 33
33 -
 34
34 -
 35
35 -
 36
36 -
 37
37 -
 38
38 -
 39
39 -
 40
40 -
41
-
42
-
43
-
44
-
45
-
46
-
47
-
48
-
49
-
50
-
51
-
52
-
53
-
54
-
55
-
56
-
57
-
58
-
59
-
60
-
61
-
62
-
63
-
64
-
65
-
66
-
67
-
68
-
69
-
70
-
71
-
72
-
73
-
74
-
75
-
76
-
77
-
78
-
79
-
80
-
81
-
82
-
83
-
84
-
85
-
86
-
87
-
88
-
89
-
90
-
91
-
92
-
93
-
94
-
95
-
96
-
97
-
98
-
99
-
100
-
101
-
102
-
103
 |
 |

29 I AMERCO ANNUAL REPORT
Management’s Discussion and Analysis
of Financial Condition and Results of Operations
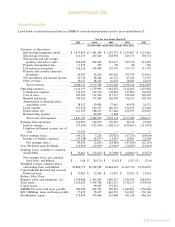
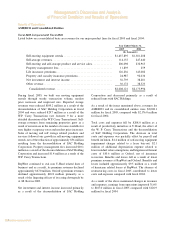
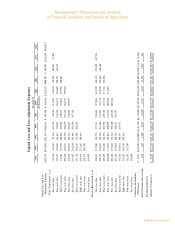
Listedbelowareearningsfromoperationsateachofourfouroperatingsegmentsforfiscal2004andfiscal2003:
Listed below are earnings from operations at each of our four operating segments for fiscal 2004 and fiscal
2003:
Year Ended March 31,
2004 2003
Moving and storage
RevenuesÏÏÏÏÏÏÏÏÏÏÏÏÏÏÏÏÏÏÏÏÏÏÏÏÏÏÏÏÏÏÏÏÏÏÏÏÏÏÏÏÏÏÏÏÏÏÏÏÏÏ $1,768,872 $1,649,683
Earnings from operations ÏÏÏÏÏÏÏÏÏÏÏÏÏÏÏÏÏÏÏÏÏÏÏÏÏÏÏÏÏÏÏÏÏÏÏÏ 93,593 68,861
Property and casualty insurance
RevenuesÏÏÏÏÏÏÏÏÏÏÏÏÏÏÏÏÏÏÏÏÏÏÏÏÏÏÏÏÏÏÏÏÏÏÏÏÏÏÏÏÏÏÏÏÏÏÏÏÏÏ 114,941 174,936
Earnings from operations ÏÏÏÏÏÏÏÏÏÏÏÏÏÏÏÏÏÏÏÏÏÏÏÏÏÏÏÏÏÏÏÏÏÏÏÏ (35,950) (7,983)
Life insurance
RevenuesÏÏÏÏÏÏÏÏÏÏÏÏÏÏÏÏÏÏÏÏÏÏÏÏÏÏÏÏÏÏÏÏÏÏÏÏÏÏÏÏÏÏÏÏÏÏÏÏÏÏ 177,812 183,220
Earnings from operations ÏÏÏÏÏÏÏÏÏÏÏÏÏÏÏÏÏÏÏÏÏÏÏÏÏÏÏÏÏÏÏÏÏÏÏÏ 11,253 (1,426)
SAC Holdings
RevenuesÏÏÏÏÏÏÏÏÏÏÏÏÏÏÏÏÏÏÏÏÏÏÏÏÏÏÏÏÏÏÏÏÏÏÏÏÏÏÏÏÏÏÏÏÏÏÏÏÏÏ 218,955 216,795
Earnings from operations ÏÏÏÏÏÏÏÏÏÏÏÏÏÏÏÏÏÏÏÏÏÏÏÏÏÏÏÏÏÏÏÏÏÏÏÏ 64,693 68,776
Eliminations
RevenuesÏÏÏÏÏÏÏÏÏÏÏÏÏÏÏÏÏÏÏÏÏÏÏÏÏÏÏÏÏÏÏÏÏÏÏÏÏÏÏÏÏÏÏÏÏÏÏÏÏÏ (104,586) (83,290)
Earnings from operations ÏÏÏÏÏÏÏÏÏÏÏÏÏÏÏÏÏÏÏÏÏÏÏÏÏÏÏÏÏÏÏÏÏÏÏÏ (6,674) (19,018)
Consolidated Results
RevenuesÏÏÏÏÏÏÏÏÏÏÏÏÏÏÏÏÏÏÏÏÏÏÏÏÏÏÏÏÏÏÏÏÏÏÏÏÏÏÏÏÏÏÏÏÏÏÏÏÏÏ 2,175,994 2,141,344
Earnings from operations ÏÏÏÏÏÏÏÏÏÏÏÏÏÏÏÏÏÏÏÏÏÏÏÏÏÏÏÏÏÏÏÏÏÏÏÏ 126,915 109,210
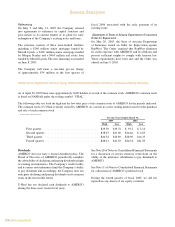
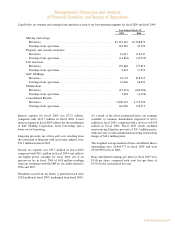
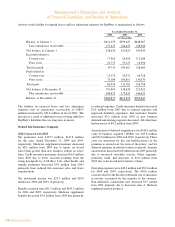
Interest expense for fiscal 2004 was $121.7 million, compared with $148.1 million in fiscal 2003. Higher
interest expense in fiscal 2003 included payments of $26.5 million for the early termination of BBAT's.
Income tax expense was $8.1 million in fiscal 2004 compared with a benefit of $13.9 million in fiscal 2003
and reflects our stronger pretax earnings for fiscal 2004 and an additional $4.8 million resulting from our
settlement with the IRS for tax audits related to 1996 and 1997.
Dividends accrued on our Series A preferred stock were $13.0 million in fiscal 2004, unchanged from
fiscal 2003.
As a result of the above mentioned items, net earnings available to common shareholders were a net loss
of $15.8 million in fiscal 2004, including non-recurring restructuring costs of $44.1 million, pre-tax, compared
with a net loss of $37.9 million in fiscal 2003.
The weighted average number of basic and diluted shares outstanding were 20,749,998 in fiscal 2004 and
were 20,824,618 in fiscal 2003.
Basic and diluted earnings per share in fiscal 2004 were a net loss per share of $0.76, compared with a net
loss per share of $1.82 for fiscal 2003.
21
Interest expense for fiscal 2004 was $121.7 million,
compared with $148.1 million in fiscal 2003. Higher
interest expense in fiscal 2003 included payments of
$26.5millionfortheearlyterminationofBBAT’s.
Income tax expense was $8.1 million in fiscal 2004
comparedwithabenefitof$13.9millioninfiscal2003
and reflects our stronger pretax earnings for fiscal
2004andan additional$4.8millionresultingfromour
settlement with the IRS for tax audits related to 1996
and1997.
Dividends accrued on our Series A preferred stock
were $13.0 million in fiscal 2004, unchanged from
fiscal2003.
As a result of the above mentioned items, net earnings
available to common shareholders were a net loss of
$15.8 million in fiscal 2004, including non-recurring
restructuring costs of $44.1 million, pre-tax, compared
withanetlossof$37.9millioninfiscal2003.
Theweightedaveragenumberofbasicanddilutedshares
outstanding were 20,749,998 in fiscal 2004 and were
20,824,618infiscal2003.
Basicanddilutedearningspershareinfiscal2004were
anetlosspershareof$0.76,comparedwithanetlossper
shareof$1.82forfiscal2003.