U-Haul 2005 Annual Report Download - page 87
Download and view the complete annual report
Please find page 87 of the 2005 U-Haul annual report below. You can navigate through the pages in the report by either clicking on the pages listed below, or by using the keyword search tool below to find specific information within the annual report.-
 1
1 -
2
-
3
-
4
-
5
-
6
-
7
-
8
-
9
-
10
-
11
-
12
-
13
-
14
-
15
-
16
-
17
-
18
-
19
-
20
-
21
-
22
-
23
-
24
-
25
-
26
-
27
-
28
-
29
-
30
-
31
-
32
-
33
-
34
-
35
-
36
-
37
-
38
-
39
-
40
-
41
-
42
-
43
-
44
-
45
-
46
-
47
-
48
-
49
-
50
-
51
-
52
-
53
-
54
-
55
-
56
-
57
-
58
-
59
-
60
-
61
-
62
-
63
-
64
-
65
-
66
-
67
-
68
-
69
-
70
-
71
-
72
-
73
-
74
-
75
-
76
-
 77
77 -
 78
78 -
 79
79 -
 80
80 -
 81
81 -
 82
82 -
 83
83 -
 84
84 -
 85
85 -
 86
86 -
 87
87 -
 88
88 -
 89
89 -
 90
90 -
 91
91 -
 92
92 -
 93
93 -
 94
94 -
 95
95 -
 96
96 -
 97
97 -
98
-
99
-
100
-
101
-
102
-
103
 |
 |

86 I AMERCO ANNUAL REPORT
Amerco and Consolidated Entities
Notes to Consolidated Financial Statements, continued
F-45
AMERCO AND CONSOLIDATED ENTITIES
NOTES TO CONSOLIDATED FINANCIAL STATEMENTS Ì (Continued)
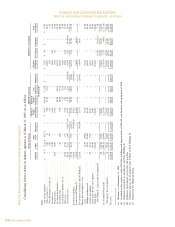
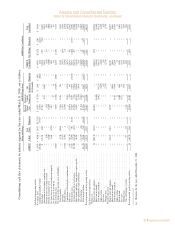
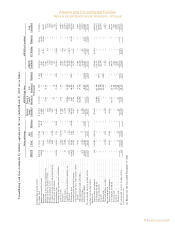
Consolidating income statements by industry segment for period ending March 31, 2003 are as follows:
Moving and Storage AMERCO Legal Group AMERCO as Consolidated
Moving & Property &
Real Storage Casualty Life AMERCO Total
AMERCO U-Haul Estate Elimination Consolidated(g) Insurance(a) Insurance(a) Elimination Consolidated SAC Holdings Elimination Consolidated
(In thousands)
Revenues:
Self-moving equipment rentalsÏÏÏÏÏÏÏÏÏÏÏÏÏÏÏÏÏÏÏÏÏÏÏÏÏÏÏ $ Ì $1,293,686 $ 46 $ Ì $1,293,732 $ Ì $ Ì $ Ì $1,293,732 $ 27,680 $(27,680)(b) $1,293,732
Self-storage revenuesÏÏÏÏÏÏÏÏÏÏÏÏÏÏÏÏÏÏÏÏÏÏÏÏÏÏÏÏÏÏÏÏÏÏÏ Ì 109,985 2,770 Ì 112,755 Ì Ì Ì 112,755 126,183 Ì 238,938
Self-moving & self-storage products and service sales ÏÏÏÏÏÏÏ Ì 174,853 56 Ì 174,909 Ì Ì Ì 174,909 48,768 Ì 223,677
Property management fees ÏÏÏÏÏÏÏÏÏÏÏÏÏÏÏÏÏÏÏÏÏÏÏÏÏÏÏÏÏÏ Ì 12,431 Ì Ì 12,431 Ì Ì Ì 12,431 Ì (12,342) 89
Life insurance premiums ÏÏÏÏÏÏÏÏÏÏÏÏÏÏÏÏÏÏÏÏÏÏÏÏÏÏÏÏÏÏÏ Ì Ì Ì Ì Ì Ì 161,398 (2,679)(c) 158,719 Ì Ì 158,719
Property & casualty insurance premiums ÏÏÏÏÏÏÏÏÏÏÏÏÏÏÏÏÏÏ Ì Ì Ì Ì Ì 152,618 Ì (3,412)(c) 149,206 Ì Ì 149,206
Net investment and interest income ÏÏÏÏÏÏÏÏÏÏÏÏÏÏÏÏÏÏÏÏÏÏ 1,158 29,358 10,695 Ì 41,211 22,318 13,891 (800) 76,620 Ì (35,889)(d) 40,731
Other revenue ÏÏÏÏÏÏÏÏÏÏÏÏÏÏÏÏÏÏÏÏÏÏÏÏÏÏÏÏÏÏÏÏÏÏÏÏÏÏÏÏ 37 18,378 56,346 (60,116)(b) 14,645 Ì 7,931 Ì 22,576 14,164 (488) 36,252
Total revenues ÏÏÏÏÏÏÏÏÏÏÏÏÏÏÏÏÏÏÏÏÏÏÏÏÏÏÏÏÏÏÏÏÏÏÏÏÏÏÏÏÏÏ 1,195 1,638,691 69,913 (60,116) 1,649,683 174,936 183,220 (6,891) 2,000,948 216,795 (76,399) 2,141,344
Costs and expenses:
Operating expenses ÏÏÏÏÏÏÏÏÏÏÏÏÏÏÏÏÏÏÏÏÏÏÏÏÏÏÏÏÏÏÏÏÏÏÏÏ 36,934 1,029,774 8,041 (60,116)(b) 1,014,633 37,096 48,480 (10,932)(c) 1,089,277 105,287 (12,342)(h) 1,182,222
Commission expenses ÏÏÏÏÏÏÏÏÏÏÏÏÏÏÏÏÏÏÏÏÏÏÏÏÏÏÏÏÏÏÏÏÏÏ Ì 166,334 Ì Ì 166,334 Ì Ì Ì 166,334 Ì (27,682)(b) 138,652
Cost of salesÏÏÏÏÏÏÏÏÏÏÏÏÏÏÏÏÏÏÏÏÏÏÏÏÏÏÏÏÏÏÏÏÏÏÏÏÏÏÏÏÏÏ Ì 93,735 21 Ì 93,756 Ì Ì Ì 93,756 21,359 Ì 115,115
Benefits and lossesÏÏÏÏÏÏÏÏÏÏÏÏÏÏÏÏÏÏÏÏÏÏÏÏÏÏÏÏÏÏÏÏÏÏÏÏÏ Ì Ì Ì Ì Ì 128,680 115,628 4,041 248,349 Ì Ì 248,349
Amortization of deferred policy acquisition costs ÏÏÏÏÏÏÏÏÏÏÏ Ì Ì Ì Ì Ì 17,143 20,538 Ì 37,681 Ì Ì 37,681
Lease expense ÏÏÏÏÏÏÏÏÏÏÏÏÏÏÏÏÏÏÏÏÏÏÏÏÏÏÏÏÏÏÏÏÏÏÏÏÏÏÏÏ 927 165,020 640 Ì 166,587 Ì Ì Ì 166,587 Ì (486)(b) 166,101
Depreciation, net ÏÏÏÏÏÏÏÏÏÏÏÏÏÏÏÏÏÏÏÏÏÏÏÏÏÏÏÏÏÏÏÏÏÏÏÏÏÏ 15 112,815 5,169 Ì 117,999 Ì Ì Ì 117,999 21,373 (1,926)(e) 137,446
Restructuring expenses ÏÏÏÏÏÏÏÏÏÏÏÏÏÏÏÏÏÏÏÏÏÏÏÏÏÏÏÏÏÏÏÏÏ 6,568 Ì Ì Ì 6,568 Ì Ì Ì 6,568 Ì Ì 6,568
Total costs and expensesÏÏÏÏÏÏÏÏÏÏÏÏÏÏÏÏÏÏÏÏÏÏÏÏÏÏÏÏÏÏÏÏÏÏ 44,444 1,567,678 13,871 (60,116) 1,565,877 182,919 184,646 (6,891) 1,926,551 148,019 (42,436) 2,032,134
Equity earnings of subsidiariesÏÏÏÏÏÏÏÏÏÏÏÏÏÏÏÏÏÏÏÏÏÏÏÏÏÏÏÏÏ 52,951 Ì Ì (59,199)(f) (6,248) Ì Ì 6,248(f) Ì Ì Ì Ì
Equity earnings of SAC Holdings ÏÏÏÏÏÏÏÏÏÏÏÏÏÏÏÏÏÏÏÏÏÏÏÏÏÏ (8,697) Ì Ì Ì (8,697) Ì Ì Ì (8,697) Ì 8,697(f) Ì
Total Ì equity earnings of subsidiaries and SAC Holdings ÏÏÏÏÏ 44,254 Ì Ì (59,199) (14,945) Ì Ì 6,248 (8,697) Ì 8,697 Ì
Earnings (losses) from operations ÏÏÏÏÏÏÏÏÏÏÏÏÏÏÏÏÏÏÏÏÏÏÏÏÏÏ 1,005 71,013 56,042 (59,199) 68,861 (7,983) (1,426) 6,248 65,700 68,776 (25,266) 109,210
Interest income (expense) ÏÏÏÏÏÏÏÏÏÏÏÏÏÏÏÏÏÏÏÏÏÏÏÏÏÏÏÏÏÏ (69,213) (9,991) (23,652) Ì (102,856) Ì Ì Ì (102,856) (81,164) 35,889(d) (148,131)
Pretax earnings (loss)ÏÏÏÏÏÏÏÏÏÏÏÏÏÏÏÏÏÏÏÏÏÏÏÏÏÏÏÏÏÏÏÏÏÏÏÏ (68,208) 61,022 32,390 (59,199) (33,995) (7,983) (1,426) 6,248 (37,156) (12,388) 10,623 (38,921)
Income tax benefit (expense) ÏÏÏÏÏÏÏÏÏÏÏÏÏÏÏÏÏÏÏÏÏÏÏÏÏÏÏ 41,296 (21,211) (13,002) Ì 7,083 2,612 549 Ì 10,244 3,691 Ì 13,935
Net earnings (loss) ÏÏÏÏÏÏÏÏÏÏÏÏÏÏÏÏÏÏÏÏÏÏÏÏÏÏÏÏÏÏÏÏÏÏÏÏÏÏ (26,912) 39,811 19,388 (59,199) (26,912) (5,371) (877) 6,248 (26,912) (8,697) 10,623 (24,986)
Less: Preferred stock dividends ÏÏÏÏÏÏÏÏÏÏÏÏÏÏÏÏÏÏÏÏÏÏÏÏÏÏÏÏ (12,963) Ì Ì Ì (12,963) Ì Ì Ì (12,963) Ì Ì (12,963)
Earnings (loss) available to common shareholders ÏÏÏÏÏÏÏÏÏÏÏÏ $(39,875) $ 39,811 $ 19,388 $(59,199) $ (39,875) $ (5,371) $ (877) $ 6,248 $ (39,875) $ (8,697) $ 10,623 $ (37,949)
(a) Balances for the year ended December 31, 2002
(b) Eliminate intercompany lease and commission income
(c) Eliminate intercompany premiums
(d) Eliminate intercompany interest on debt
(e) Eliminate gain on sale of surplus property from U-Haul to SAC Holdings
(f) Eliminate equity earnings of subsidiaries and equity earnings in SAC Holdings
(g) Represents the Obligated Group
(h) Eliminate management fees charged to SAC Holdings and other intercompany operating expenses