U-Haul 2005 Annual Report Download - page 31
Download and view the complete annual report
Please find page 31 of the 2005 U-Haul annual report below. You can navigate through the pages in the report by either clicking on the pages listed below, or by using the keyword search tool below to find specific information within the annual report.-
 1
1 -
2
-
3
-
4
-
5
-
6
-
7
-
8
-
9
-
10
-
11
-
12
-
13
-
14
-
15
-
16
-
17
-
18
-
19
-
20
-
 21
21 -
 22
22 -
 23
23 -
 24
24 -
 25
25 -
 26
26 -
 27
27 -
 28
28 -
 29
29 -
 30
30 -
 31
31 -
 32
32 -
 33
33 -
 34
34 -
 35
35 -
 36
36 -
 37
37 -
 38
38 -
 39
39 -
 40
40 -
 41
41 -
42
-
43
-
44
-
45
-
46
-
47
-
48
-
49
-
50
-
51
-
52
-
53
-
54
-
55
-
56
-
57
-
58
-
59
-
60
-
61
-
62
-
63
-
64
-
65
-
66
-
67
-
68
-
69
-
70
-
71
-
72
-
73
-
74
-
75
-
76
-
77
-
78
-
79
-
80
-
81
-
82
-
83
-
84
-
85
-
86
-
87
-
88
-
89
-
90
-
91
-
92
-
93
-
94
-
95
-
96
-
97
-
98
-
99
-
100
-
101
-
102
-
103
 |
 |

30 I AMERCO ANNUAL REPORT
Management’s Discussion and Analysis
of Financial Condition and Results of Operations
MovingandStorage
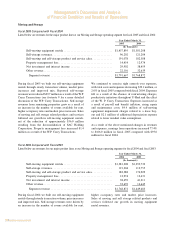
Fiscal 2005 Compared with Fiscal 2004
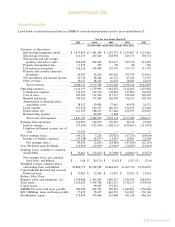
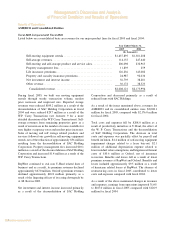
ListedbelowarerevenuesforthemajorproductlinesatourMovingandStorageoperatingsegmentforfiscal2005andfiscal2004:
Moving and Storage
Fiscal 2005 Compared with Fiscal 2004
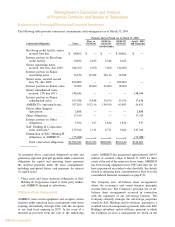
Listed below are revenues for the major product lines at our Moving and Storage operating segment for
fiscal 2005 and fiscal 2004:
Year Ended March 31,
2005 2004
(In thousands)
Self-moving equipment rentals ÏÏÏÏÏÏÏÏÏÏÏÏÏÏÏÏÏÏÏÏÏÏÏÏÏÏÏÏÏÏÏÏÏÏ $1,437,895 $1,381,208
Self-storage revenues ÏÏÏÏÏÏÏÏÏÏÏÏÏÏÏÏÏÏÏÏÏÏÏÏÏÏÏÏÏÏÏÏÏÏÏÏÏÏÏÏÏÏ 96,202 121,204
Self-moving and self-storage product and service sales ÏÏÏÏÏÏÏÏÏÏÏÏÏÏ 191,078 182,388
Property management fees ÏÏÏÏÏÏÏÏÏÏÏÏÏÏÏÏÏÏÏÏÏÏÏÏÏÏÏÏÏÏÏÏÏÏÏÏÏ 14,434 12,974
Net investment and interest income ÏÏÏÏÏÏÏÏÏÏÏÏÏÏÏÏÏÏÏÏÏÏÏÏÏÏÏÏÏ 29,902 38,459
Other revenueÏÏÏÏÏÏÏÏÏÏÏÏÏÏÏÏÏÏÏÏÏÏÏÏÏÏÏÏÏÏÏÏÏÏÏÏÏÏÏÏÏÏÏÏÏÏÏÏ 22,156 32,639
Segment revenue ÏÏÏÏÏÏÏÏÏÏÏÏÏÏÏÏÏÏÏÏÏÏÏÏÏÏÏÏÏÏÏÏÏÏÏÏÏÏÏÏÏÏÏ $1,791,667 $1,768,872
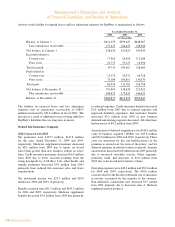
During fiscal 2005 we built our self-moving equipment rentals through steady transaction volume, modest
price increases and improved mix. Reported self-storage revenues were reduced $29.7 million as a result of the
W.P. Carey Transactions (see footnote 9 for a more detailed discussion of the W.P. Carey Transactions).
Self-storage revenues from remaining properties grew as a result of an increase in the number of rooms
available for rent, higher occupancy rates and modest price increases. Sales of moving and self storage related
products and services followed our growth in self-moving equipment rentals, net of the reduction of
approximately $36.0 million resulting from the deconsolidation of SAC Holding Corporation. Property
management fees increased $1.4 million as a result of the W.P. Carey Transactions.
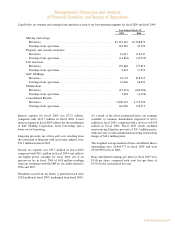
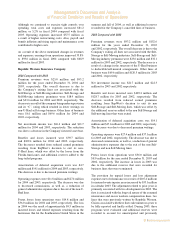
We continued to exercise tight controls over expenses, with total costs and expenses decreasing
$32.1 million, or 2.0% in fiscal 2005 compared with fiscal 2004. Expenses fell as a result of the absence of
restructuring charges, productivity initiatives throughout U-Haul and the effect of the W. P. Carey
Transaction. Expenses increased as a result of payroll and benefit inflation, rising repair and maintenance
costs, $4.4 million of self-moving equipment impairment charges related to a lease buy-out and $2.1 million of
additional depreciation expense related to lower residual value assumptions.
As a result of the above mentioned changes in revenues and expenses, earnings from operations increased
77.4% to $166.0 million in fiscal 2005 compared with $93.6 million for fiscal 2004.
Fiscal 2004 Compared with Fiscal 2003
Listed below are revenues for our major product lines at our Moving and Storage operating segment for
fiscal 2004 and fiscal 2003:
Year Ended March 31,
2004 2003
(In thousands)
Self-moving equipment rentals ÏÏÏÏÏÏÏÏÏÏÏÏÏÏÏÏÏÏÏÏÏÏÏÏÏÏÏÏÏÏÏÏÏÏ $1,381,208 $1,293,732
Self-storage revenues ÏÏÏÏÏÏÏÏÏÏÏÏÏÏÏÏÏÏÏÏÏÏÏÏÏÏÏÏÏÏÏÏÏÏÏÏÏÏÏÏÏÏ 121,204 112,755
Self-moving and self-storage product and service sales ÏÏÏÏÏÏÏÏÏÏÏÏÏÏ 182,388 174,909
Property management fees ÏÏÏÏÏÏÏÏÏÏÏÏÏÏÏÏÏÏÏÏÏÏÏÏÏÏÏÏÏÏÏÏÏÏÏÏÏ 12,974 12,431
Net investment and interest income ÏÏÏÏÏÏÏÏÏÏÏÏÏÏÏÏÏÏÏÏÏÏÏÏÏÏÏÏÏ 38,459 41,211
Other revenueÏÏÏÏÏÏÏÏÏÏÏÏÏÏÏÏÏÏÏÏÏÏÏÏÏÏÏÏÏÏÏÏÏÏÏÏÏÏÏÏÏÏÏÏÏÏÏÏ 32,639 14,645
Segment revenue ÏÏÏÏÏÏÏÏÏÏÏÏÏÏÏÏÏÏÏÏÏÏÏÏÏÏÏÏÏÏÏÏÏÏÏÏÏÏÏÏÏÏÏ $1,768,872 $1,649,683
22
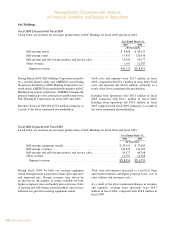
Moving and Storage
Fiscal 2005 Compared with Fiscal 2004
Listed below are revenues for the major product lines at our Moving and Storage operating segment for
fiscal 2005 and fiscal 2004:
Year Ended March 31,
2005 2004
(In thousands)
Self-moving equipment rentals ÏÏÏÏÏÏÏÏÏÏÏÏÏÏÏÏÏÏÏÏÏÏÏÏÏÏÏÏÏÏÏÏÏÏ $1,437,895 $1,381,208
Self-storage revenues ÏÏÏÏÏÏÏÏÏÏÏÏÏÏÏÏÏÏÏÏÏÏÏÏÏÏÏÏÏÏÏÏÏÏÏÏÏÏÏÏÏÏ 96,202 121,204
Self-moving and self-storage product and service sales ÏÏÏÏÏÏÏÏÏÏÏÏÏÏ 191,078 182,388
Property management fees ÏÏÏÏÏÏÏÏÏÏÏÏÏÏÏÏÏÏÏÏÏÏÏÏÏÏÏÏÏÏÏÏÏÏÏÏÏ 14,434 12,974
Net investment and interest income ÏÏÏÏÏÏÏÏÏÏÏÏÏÏÏÏÏÏÏÏÏÏÏÏÏÏÏÏÏ 29,902 38,459
Other revenueÏÏÏÏÏÏÏÏÏÏÏÏÏÏÏÏÏÏÏÏÏÏÏÏÏÏÏÏÏÏÏÏÏÏÏÏÏÏÏÏÏÏÏÏÏÏÏÏ 22,156 32,639
Segment revenue ÏÏÏÏÏÏÏÏÏÏÏÏÏÏÏÏÏÏÏÏÏÏÏÏÏÏÏÏÏÏÏÏÏÏÏÏÏÏÏÏÏÏÏ $1,791,667 $1,768,872
During fiscal 2005 we built our self-moving equipment rentals through steady transaction volume, modest
price increases and improved mix. Reported self-storage revenues were reduced $29.7 million as a result of the
W.P. Carey Transactions (see footnote 9 for a more detailed discussion of the W.P. Carey Transactions).
Self-storage revenues from remaining properties grew as a result of an increase in the number of rooms
available for rent, higher occupancy rates and modest price increases. Sales of moving and self storage related
products and services followed our growth in self-moving equipment rentals, net of the reduction of
approximately $36.0 million resulting from the deconsolidation of SAC Holding Corporation. Property
management fees increased $1.4 million as a result of the W.P. Carey Transactions.
We continued to exercise tight controls over expenses, with total costs and expenses decreasing
$32.1 million, or 2.0% in fiscal 2005 compared with fiscal 2004. Expenses fell as a result of the absence of
restructuring charges, productivity initiatives throughout U-Haul and the effect of the W. P. Carey
Transaction. Expenses increased as a result of payroll and benefit inflation, rising repair and maintenance
costs, $4.4 million of self-moving equipment impairment charges related to a lease buy-out and $2.1 million of
additional depreciation expense related to lower residual value assumptions.
As a result of the above mentioned changes in revenues and expenses, earnings from operations increased
77.4% to $166.0 million in fiscal 2005 compared with $93.6 million for fiscal 2004.
Fiscal 2004 Compared with Fiscal 2003
Listed below are revenues for our major product lines at our Moving and Storage operating segment for
fiscal 2004 and fiscal 2003:
Year Ended March 31,
2004 2003
(In thousands)
Self-moving equipment rentals ÏÏÏÏÏÏÏÏÏÏÏÏÏÏÏÏÏÏÏÏÏÏÏÏÏÏÏÏÏÏÏÏÏÏ $1,381,208 $1,293,732
Self-storage revenues ÏÏÏÏÏÏÏÏÏÏÏÏÏÏÏÏÏÏÏÏÏÏÏÏÏÏÏÏÏÏÏÏÏÏÏÏÏÏÏÏÏÏ 121,204 112,755
Self-moving and self-storage product and service sales ÏÏÏÏÏÏÏÏÏÏÏÏÏÏ 182,388 174,909
Property management fees ÏÏÏÏÏÏÏÏÏÏÏÏÏÏÏÏÏÏÏÏÏÏÏÏÏÏÏÏÏÏÏÏÏÏÏÏÏ 12,974 12,431
Net investment and interest income ÏÏÏÏÏÏÏÏÏÏÏÏÏÏÏÏÏÏÏÏÏÏÏÏÏÏÏÏÏ 38,459 41,211
Other revenueÏÏÏÏÏÏÏÏÏÏÏÏÏÏÏÏÏÏÏÏÏÏÏÏÏÏÏÏÏÏÏÏÏÏÏÏÏÏÏÏÏÏÏÏÏÏÏÏ 32,639 14,645
Segment revenue ÏÏÏÏÏÏÏÏÏÏÏÏÏÏÏÏÏÏÏÏÏÏÏÏÏÏÏÏÏÏÏÏÏÏÏÏÏÏÏÏÏÏÏ $1,768,872 $1,649,683
22
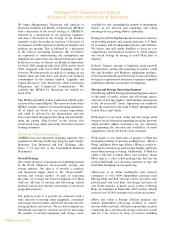
Duringfiscal 2005we builtour self-movingequipment
rentalsthroughsteadytransactionvolume,modestprice
increases and improved mix. Reported self-storage
revenueswerereduced$29.7millionasaresultoftheW.P.
Carey Transactions (see footnote 9 for a more detailed
discussionoftheW.P.CareyTransactions).Self-storage
revenues from remaining properties grew as a result of
an increase in the number of rooms available for rent,
higheroccupancyratesandmodestpriceincreases.Sales
ofmovingandselfstoragerelatedproductsandservices
followed our growth in self-moving equipment rentals,
net of the reduction of approximately $36.0 million
resulting from the deconsolidation of SAC Holding
Corporation. Property management fees increased $1.4
millionasaresultoftheW.P.CareyTransactions.
We continued to exercise tight controls over expenses,
withtotalcostsandexpensesdecreasing$32.1million,or
2.0%infiscal2005comparedwithfiscal2004.Expenses
fell as a result of the absence of restructuring charges,
productivityinitiativesthroughoutU-Haulandtheeffect
of the W. P. Carey Transaction. Expenses increased as
a result of payroll and benefit inflation, rising repair
and maintenance costs, $4.4 million of self-moving
equipment impairment charges related to a lease buy-
outand $2.1millionofadditionaldepreciationexpense
relatedtolowerresidualvalueassumptions.
Asaresultoftheabovementionedchangesinrevenues
andexpenses,earningsfromoperationsincreased77.4%
to $166.0 million in fiscal 2005 compared with $93.6
millionforfiscal2004.
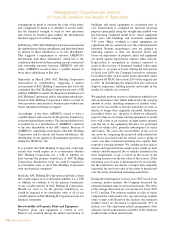
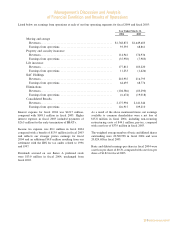
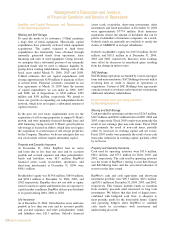
Duringfiscal 2004webuiltourself-movingequipment
rentalsthroughsteadytransactionvolume,priceincreases
andimprovedmix.Self-storagerevenuesweredrivenby
an increase in the number of rooms available for rent,
higher occupancy rates and modest price increases.
Sales of moving and self storage related products and
services followed our growth in moving equipment
rentalrevenues.
Fiscal 2004 Compared with Fiscal 2003
ListedbelowarerevenuesforourmajorproductlinesatourMovingandStorageoperatingsegmentforfiscal2004andfiscal2003: