U-Haul 2005 Annual Report Download - page 37
Download and view the complete annual report
Please find page 37 of the 2005 U-Haul annual report below. You can navigate through the pages in the report by either clicking on the pages listed below, or by using the keyword search tool below to find specific information within the annual report.-
 1
1 -
2
-
3
-
4
-
5
-
6
-
7
-
8
-
9
-
10
-
11
-
12
-
13
-
14
-
15
-
16
-
17
-
18
-
19
-
20
-
21
-
22
-
23
-
24
-
25
-
26
-
 27
27 -
 28
28 -
 29
29 -
 30
30 -
 31
31 -
 32
32 -
 33
33 -
 34
34 -
 35
35 -
 36
36 -
 37
37 -
 38
38 -
 39
39 -
 40
40 -
 41
41 -
 42
42 -
 43
43 -
 44
44 -
 45
45 -
 46
46 -
 47
47 -
48
-
49
-
50
-
51
-
52
-
53
-
54
-
55
-
56
-
57
-
58
-
59
-
60
-
61
-
62
-
63
-
64
-
65
-
66
-
67
-
68
-
69
-
70
-
71
-
72
-
73
-
74
-
75
-
76
-
77
-
78
-
79
-
80
-
81
-
82
-
83
-
84
-
85
-
86
-
87
-
88
-
89
-
90
-
91
-
92
-
93
-
94
-
95
-
96
-
97
-
98
-
99
-
100
-
101
-
102
-
103
 |
 |

36 I AMERCO ANNUAL REPORT
Management’s Discussion and Analysis
of Financial Condition and Results of Operations
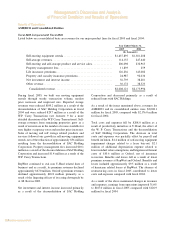
SACHoldings
Fiscal 2005 Compared with Fiscal 2004
ListedbelowarerevenuesforourmajorproductlinesatSACHoldingsforfiscal2005andfiscal2004:
of the variance. Non-deferrable commissions have decreased $5.5 million from 2003 primarily due to
decreased sales of Medicare supplement and life products.
Earnings from operations were $2.1 million and $11.3 million for 2004 and 2003, respectively. The
decrease in 2004 from 2003 is due primarily to the $10.6 million accrual for the Kocher settlement offset by
improved investment income, and positive loss experience in the Medicare supplement and Credit insurance
segments.
2003 Compared with 2002
Net premiums were $147.8 million and $161.4 million for 2003 and 2002, respectively. Medicare
supplement premiums decreased by $3.5 million from 2002. Life Insurance premiums decreased $4.1 million
from 2002. Credit life and disability premiums decreased $4.8 million from 2002 due to account cancellations
and decreased penetration. Other health and annuity premiums decreased $1.3 million from 2002 primarily
from reduced life insurance sales.
Net investment income was $19.0 million and $13.9 million for 2003 and 2002, respectively. The increase
from 2002 is due to fewer capital losses and fewer limited partnership losses offset by a lower invested asset
base and reduced reinvestment rates.
Benefits incurred were $103.5 million and $115.6 million for 2003 and 2002, respectively. Medicare
supplement benefits decreased $6.5 million from 2002 primarily due to decreased exposure and improved
experience. Credit insurance benefits decreased $2.3 million from 2002 due to reduced exposure. Benefits
from other health lines increased $0.3 million from 2002 due to increased morbidity. Annuity and life benefits
decreased $3.6 million from 2002 due to decreases in life insurance exposure.
Amortization of deferred acquisition costs (DAC) and the value of business acquired (VOBA) was
$25.0 million and $20.5 million for 2003 and 2002, respectively. These costs are amortized for life and health
policies as the premium is earned over the term of the policy; and for deferred annuities in relation to interest
spreads. Amortization associated with annuity policies increased $6.4 million from 2002 primarily due to
increased surrender activity. Other segments decreased $1.9 million from 2002 due to decreased new business
volume.
Operating expenses were $38.1 million and $48.5 million for 2003 and 2002, respectively. Commissions
decreased $4.1 million from 2002 primarily due to decreases in new business. General and administrative
expenses decreased $6.3 million from 2002.
Earnings/(losses) from operations were $11.3 million and ($1.4) million for 2003 and 2002, respectively.
The increase from 2002 is due primarily from fewer other than temporary declines in the investment portfolio
and improved loss ratios in the Medicare supplement segment.
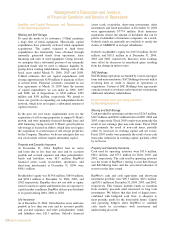
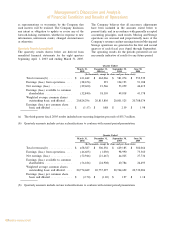
SAC Holdings
Fiscal 2005 Compared with Fiscal 2004
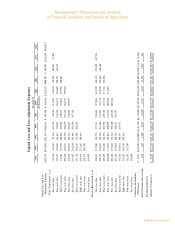
Listed below are revenues for our major product lines at SAC Holdings for fiscal 2005 and fiscal 2004:
Year Ended March 31,
2005 2004
(In thousands)
Self-moving rental ÏÏÏÏÏÏÏÏÏÏÏÏÏÏÏÏÏÏÏÏÏÏÏÏÏÏÏÏÏÏÏÏÏÏÏÏÏÏÏÏÏÏÏÏÏÏÏÏ $ 9,008 $ 29,155
Self-storage rental ÏÏÏÏÏÏÏÏÏÏÏÏÏÏÏÏÏÏÏÏÏÏÏÏÏÏÏÏÏÏÏÏÏÏÏÏÏÏÏÏÏÏÏÏÏÏÏÏ 17,953 126,436
Self-moving and self-storage product and service sales ÏÏÏÏÏÏÏÏÏÏÏÏÏÏÏÏÏÏ 15,020 50,577
Other revenueÏÏÏÏÏÏÏÏÏÏÏÏÏÏÏÏÏÏÏÏÏÏÏÏÏÏÏÏÏÏÏÏÏÏÏÏÏÏÏÏÏÏÏÏÏÏÏÏÏÏÏÏ 1,191 12,787
Segment revenue ÏÏÏÏÏÏÏÏÏÏÏÏÏÏÏÏÏÏÏÏÏÏÏÏÏÏÏÏÏÏÏÏÏÏÏÏÏÏÏÏÏÏÏÏÏÏÏ $43,172 $218,955
28
During March 2004, SAC Holding Corporation ceased to be a variable interest entity and AMERCO
ceased being the primary beneficiary of SAC Holding Corporation. As a result of this, AMERCO
deconsolidated its interests in SAC Holding Corporation at that time. AMERCO remains the primary
beneficiary of its contractual variable interests in SAC Holding II Corporation for fiscal 2005 and 2004.
Revenues for fiscal 2005 fell $175.8 million, primarily as a result of the above mentioned deconsolidation.
Total costs and expenses were $32.7 million in fiscal 2005, compared with $154.3 million in fiscal 2004.
Total costs and expenses fell $121.6 million, primarily as a result of the above mentioned deconsolidation.
Earnings from operations were $10.5 million in fiscal 2005 compared with $64.7 million in fiscal 2004.
Earnings from operations fell $54.2 million in fiscal 2005 compared with fiscal 2004, primarily as a result of
the above mentioned deconsolidation.
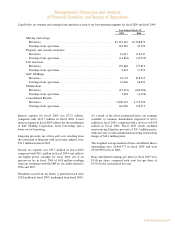
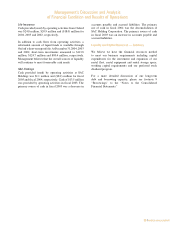
Fiscal 2004 Compared with Fiscal 2003
Listed below are revenues for our major product lines at SAC Holdings for fiscal 2004 and fiscal 2003:
Year Ended March 31,
2004 2003
(In thousands)
Self-moving equipment rentals ÏÏÏÏÏÏÏÏÏÏÏÏÏÏÏÏÏÏÏÏÏÏÏÏÏÏÏÏÏÏÏÏÏÏÏÏÏ $ 29,155 $ 27,680
Self-storage revenues ÏÏÏÏÏÏÏÏÏÏÏÏÏÏÏÏÏÏÏÏÏÏÏÏÏÏÏÏÏÏÏÏÏÏÏÏÏÏÏÏÏÏÏÏÏ 126,436 126,183
Self-moving and self-storage product and service sales ÏÏÏÏÏÏÏÏÏÏÏÏÏÏÏÏÏ 50,577 48,768
Other revenueÏÏÏÏÏÏÏÏÏÏÏÏÏÏÏÏÏÏÏÏÏÏÏÏÏÏÏÏÏÏÏÏÏÏÏÏÏÏÏÏÏÏÏÏÏÏÏÏÏÏÏ 12,787 14,164
Segment revenue ÏÏÏÏÏÏÏÏÏÏÏÏÏÏÏÏÏÏÏÏÏÏÏÏÏÏÏÏÏÏÏÏÏÏÏÏÏÏÏÏÏÏÏÏÏÏ $218,955 $216,795
During fiscal 2004 we built our moving equipment rentals through steady transaction volume, price
increases and improved mix. Storage revenues were driven by an increase in the number of rooms available for
rent, higher occupancy rates and modest price increases. Sales of moving and self-storage related products and
services followed our growth in moving equipment rentals.
Total costs and expenses increased as a result of wage and benefit inflation and higher property taxes, cost
of sales, utilities and insurance costs.
As a result of the above mentioned changes in revenues and expenses, earnings from operations were
$64.7 million in fiscal 2004, compared with $68.8 million in fiscal 2003.
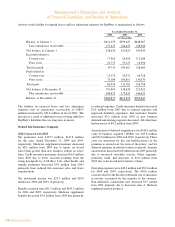
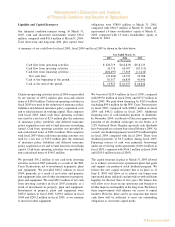
Liquidity and Capital Resources
Our financial condition remains strong. At March 31, 2005, cash and short-term investments totaled
$56.0 million, compared with $81.6 million at March 31, 2004. Total short-term and long-term debt, plus
capital lease obligations were $780.0 million at March 31, 2005, compared with $962.3 million at March 31,
2004, and represented 1.4 times stockholders' equity at March 31, 2005, compared with 1.9 times
stockholders' equity at March 31, 2004.
A summary of our cash flows for fiscal 2005, fiscal 2004 and fiscal 2003 is shown in the table below:
Year Ended March 31,
2005 2004 2003
(In thousands)
Cash flow from operating activitiesÏÏÏÏÏÏÏÏÏÏÏÏÏÏÏÏÏÏÏÏÏÏ $ 220,719 $(62,833) $118,133
Cash flow from investing activities ÏÏÏÏÏÏÏÏÏÏÏÏÏÏÏÏÏÏÏÏÏÏ 36,176 60,187 (81,113)
Cash flow from financing activitiesÏÏÏÏÏÏÏÏÏÏÏÏÏÏÏÏÏÏÏÏÏÏ (282,497) 17,369 (11,632)
Net cash flow ÏÏÏÏÏÏÏÏÏÏÏÏÏÏÏÏÏÏÏÏÏÏÏÏÏÏÏÏÏÏÏÏÏÏÏÏÏ (25,602) 14,723 25,388
Cash at the beginning of the period ÏÏÏÏÏÏÏÏÏÏÏÏÏÏÏÏÏÏÏÏÏ 81,557 66,834 41,446
Cash at the end of the period ÏÏÏÏÏÏÏÏÏÏÏÏÏÏÏÏÏÏÏÏÏÏÏÏÏÏ $ 55,955 $ 81,557 $ 66,834
29
DuringMarch2004,SACHoldingCorporationceasedto
beavariableinterestentityandAMERCOceasedbeing
theprimarybeneficiaryofSACHoldingCorporation.Asa
resultofthis,AMERCOdeconsolidateditsinterestsinSAC
HoldingCorporationatthattime.AMERCOremainsthe
primarybeneficiaryofitscontractualvariableinterestsin
SACHoldingIICorporationforfiscal2005and2004.
Revenuesforfiscal2005fell$175.8million,primarilyas
aresultoftheabovementioneddeconsolidation.
Total costs and expenses were $32.7 million in fiscal
2005,comparedwith$154.3millioninfiscal2004.Total
costs and expenses fell $121.6 million, primarily as a
resultoftheabovementioneddeconsolidation.
Earnings from operations were $10.5 million in fiscal
2005 compared with $64.7 million in fiscal 2004.
Earnings from operations fell $54.2 million in fiscal
2005comparedwithfiscal2004,primarilyasaresultof
theabovementioneddeconsolidation.
During fiscal 2004 we built our moving equipment
rentalsthroughsteadytransactionvolume,priceincreases
and improved mix. Storage revenues were driven by
an increase in the number of rooms available for rent,
higheroccupancyratesandmodestpriceincreases.Sales
ofmovingandself-storagerelatedproductsandservices
followedourgrowthinmovingequipmentrentals.
Total costs and expenses increased as a result of wage
and benefit inflation and higher property taxes, cost of
sales,utilitiesandinsurancecosts.
Asaresultoftheabovementionedchangesinrevenues
and expenses, earnings from operations were $64.7
millioninfiscal 2004,compared with $68.8millionin
fiscal2003.
Fiscal 2004 Compared with Fiscal 2003
ListedbelowarerevenuesforourmajorproductlinesatSACHoldingsforfiscal2004andfiscal2003: