U-Haul 2005 Annual Report Download - page 85
Download and view the complete annual report
Please find page 85 of the 2005 U-Haul annual report below. You can navigate through the pages in the report by either clicking on the pages listed below, or by using the keyword search tool below to find specific information within the annual report.-
 1
1 -
2
-
3
-
4
-
5
-
6
-
7
-
8
-
9
-
10
-
11
-
12
-
13
-
14
-
15
-
16
-
17
-
18
-
19
-
20
-
21
-
22
-
23
-
24
-
25
-
26
-
27
-
28
-
29
-
30
-
31
-
32
-
33
-
34
-
35
-
36
-
37
-
38
-
39
-
40
-
41
-
42
-
43
-
44
-
45
-
46
-
47
-
48
-
49
-
50
-
51
-
52
-
53
-
54
-
55
-
56
-
57
-
58
-
59
-
60
-
61
-
62
-
63
-
64
-
65
-
66
-
67
-
68
-
69
-
70
-
71
-
72
-
73
-
74
-
 75
75 -
 76
76 -
 77
77 -
 78
78 -
 79
79 -
 80
80 -
 81
81 -
 82
82 -
 83
83 -
 84
84 -
 85
85 -
 86
86 -
 87
87 -
 88
88 -
 89
89 -
 90
90 -
 91
91 -
 92
92 -
 93
93 -
 94
94 -
 95
95 -
96
-
97
-
98
-
99
-
100
-
101
-
102
-
103
 |
 |

84 I AMERCO ANNUAL REPORT
Amerco and Consolidated Entities
Notes to Consolidated Financial Statements, continued
F-43
AMERCO AND CONSOLIDATED ENTITIES
NOTES TO CONSOLIDATED FINANCIAL STATEMENTS Ì (Continued)
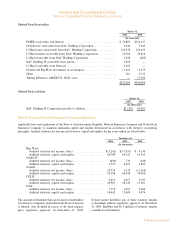
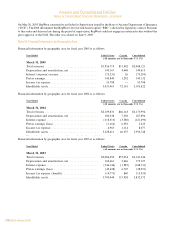
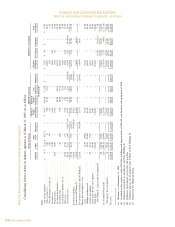
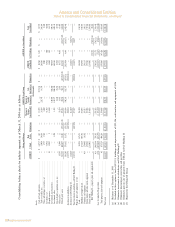
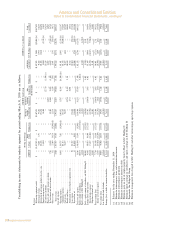
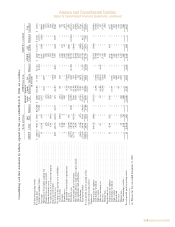
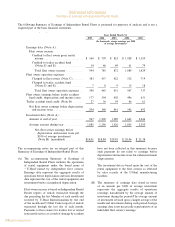
Consolidating income statements by industry segment for period ending March 31, 2005 are as follows:
AMERCO Legal Group AMERCO as Consolidated
Moving and Storage Moving & Property &
Real Storage Casualty Life AMERCO Total
AMERCO U-Haul Estate Eliminations Consolidated(g) Insurance(a) Insurance(a) Eliminations Consolidated SAC Holdings Eliminations Consolidated
(In thousands)
Revenues:
Self-moving equipment rentals ÏÏÏÏÏÏÏÏÏÏÏÏÏÏÏÏÏÏÏÏÏÏÏÏÏ $ Ì $1,437,895 $ Ì $ Ì $1,437,895 $ Ì $ Ì $ Ì $1,437,895 $ 9,008 $(9,008)(b) $1,437,895
Self-storage revenues ÏÏÏÏÏÏÏÏÏÏÏÏÏÏÏÏÏÏÏÏÏÏÏÏÏÏÏÏÏÏÏÏÏ Ì 94,431 1,771 Ì 96,202 Ì Ì Ì 96,202 17,953 Ì 114,155
Self-moving & self-storage products & service sales ÏÏÏÏÏÏÏ Ì 191,078 Ì Ì 191,078 Ì Ì Ì 191,078 15,020 Ì 206,098
Property management fees ÏÏÏÏÏÏÏÏÏÏÏÏÏÏÏÏÏÏÏÏÏÏÏÏÏÏÏÏ Ì 14,434 Ì Ì 14,434 Ì Ì Ì 14,434 Ì (2,595)(h) 11,839
Life insurance premiums ÏÏÏÏÏÏÏÏÏÏÏÏÏÏÏÏÏÏÏÏÏÏÏÏÏÏÏÏÏÏ Ì Ì Ì Ì Ì Ì 127,710 (1,474)(c) 126,236 Ì Ì 126,236
Property and casualty insurance premiums ÏÏÏÏÏÏÏÏÏÏÏÏÏÏÏ Ì Ì Ì Ì Ì 24,987 Ì Ì 24,987 Ì Ì 24,987
Net investment and interest incomeÏÏÏÏÏÏÏÏÏÏÏÏÏÏÏÏÏÏÏÏÏ 7,796 22,030 76 Ì 29,902 16,430 23,476 (5,109) 64,699 Ì (7,960)(d) 56,739
Other revenue ÏÏÏÏÏÏÏÏÏÏÏÏÏÏÏÏÏÏÏÏÏÏÏÏÏÏÏÏÏÏÏÏÏÏÏÏÏÏÏ 552 27,489 56,116 (62,001)(b) 22,156 Ì 8,298 (763) 29,691 1,191 (710)(b) 30,172
Total revenuesÏÏÏÏÏÏÏÏÏÏÏÏÏÏÏÏÏÏÏÏÏÏÏÏÏÏÏÏÏÏÏÏÏÏÏÏÏ 8,348 1,787,357 57,963 (62,001) 1,791,667 41,417 159,484 (7,346) 1,985,222 43,172 (20,273) 2,008,121
Costs and expenses:
Operating expensesÏÏÏÏÏÏÏÏÏÏÏÏÏÏÏÏÏÏÏÏÏÏÏÏÏÏÏÏÏÏÏÏÏÏÏ 18,065 1,100,737 7,051 (62,001)(b) 1,063,852 11,787 42,166 (16,504)(b,c) 1,101,301 23,491 (2,595)(h) 1,122,197
Commission expensesÏÏÏÏÏÏÏÏÏÏÏÏÏÏÏÏÏÏÏÏÏÏÏÏÏÏÏÏÏÏÏÏÏ Ì 181,315 Ì Ì 181,315 Ì Ì Ì 181,315 Ì (9,008)(b) 172,307
Cost of sales ÏÏÏÏÏÏÏÏÏÏÏÏÏÏÏÏÏÏÏÏÏÏÏÏÏÏÏÏÏÏÏÏÏÏÏÏÏÏÏÏ Ì 98,877 Ì Ì 98,877 Ì Ì Ì 98,877 6,432 Ì 105,309
Benefits and losses ÏÏÏÏÏÏÏÏÏÏÏÏÏÏÏÏÏÏÏÏÏÏÏÏÏÏÏÏÏÏÏÏÏÏÏ Ì Ì Ì Ì Ì 39,733 91,452 9,158 140,343 Ì Ì 140,343
Amortization of deferred policy acquisition costs ÏÏÏÏÏÏÏÏÏÏ Ì Ì Ì Ì Ì 4,711 23,801 Ì 28,512 Ì Ì 28,512
Lease expense ÏÏÏÏÏÏÏÏÏÏÏÏÏÏÏÏÏÏÏÏÏÏÏÏÏÏÏÏÏÏÏÏÏÏÏÏÏÏÏ 90 151,937 37 Ì 152,064 Ì Ì Ì 152,064 Ì (710)(b) 151,354
Depreciation, net ÏÏÏÏÏÏÏÏÏÏÏÏÏÏÏÏÏÏÏÏÏÏÏÏÏÏÏÏÏÏÏÏÏÏÏÏ 31 114,038 4,811 Ì 118,880 Ì Ì Ì 118,880 2,783 (560)(e) 121,103
Total costs and expenses ÏÏÏÏÏÏÏÏÏÏÏÏÏÏÏÏÏÏÏÏÏÏÏÏÏÏÏÏÏÏÏÏ 18,186 1,646,904 11,899 (62,001) 1,614,988 56,231 157,419 (7,346) 1,821,292 32,706 (12,873) 1,841,125
Equity earnings of subsidiaries ÏÏÏÏÏÏÏÏÏÏÏÏÏÏÏÏÏÏÏÏÏÏÏÏÏÏÏ 108,673 Ì Ì (117,135)(f) (8,462) Ì Ì 8,462(f) Ì Ì Ì Ì
Equity earnings of SAC Holding IIÏÏÏÏÏÏÏÏÏÏÏÏÏÏÏÏÏÏÏÏÏÏÏ (2,232) Ì Ì Ì (2,232) Ì Ì Ì (2,232) Ì 2,232(f) Ì
Total Ì equity earnings of subsidiaries and SAC Holding II ÏÏ 106,441 Ì Ì (117,135) (10,694) Ì Ì 8,462 (2,232) Ì 2,232 Ì
Earnings (loss) from operations ÏÏÏÏÏÏÏÏÏÏÏÏÏÏÏÏÏÏÏÏÏÏÏÏÏÏ 96,603 140,453 46,064 (117,135) 165,985 (14,814) 2,065 8,462 161,698 10,466 (5,168) 166,996
Interest income (expense) ÏÏÏÏÏÏÏÏÏÏÏÏÏÏÏÏÏÏÏÏÏÏÏÏÏÏÏÏ (70,235) 15,687 (12,430) Ì (66,978) Ì Ì Ì (66,978) (14,187) 7,960(d) (73,205)
Litigation settlement, netÏÏÏÏÏÏÏÏÏÏÏÏÏÏÏÏÏÏÏÏÏÏÏÏÏÏÏÏÏÏ 51,341 Ì Ì Ì 51,341 Ì Ì Ì 51,341 Ì Ì 51,341
Pretax earnings (loss) ÏÏÏÏÏÏÏÏÏÏÏÏÏÏÏÏÏÏÏÏÏÏÏÏÏÏÏÏÏÏÏÏÏÏ 77,709 156,140 33,634 (117,135) 150,348 (14,814) 2,065 8,462 146,061 (3,721) 2,792 145,132
Income tax benefit (expense)ÏÏÏÏÏÏÏÏÏÏÏÏÏÏÏÏÏÏÏÏÏÏÏÏÏÏ 11,367 (59,160) (13,479) Ì (61,272) 5,104 (817) Ì (56,985) 1,489 (212) (55,708)
Net earnings (loss) ÏÏÏÏÏÏÏÏÏÏÏÏÏÏÏÏÏÏÏÏÏÏÏÏÏÏÏÏÏÏÏÏÏÏÏÏ 89,076 96,980 20,155 (117,135) 89,076 (9,710) 1,248 8,462 89,076 (2,232) 2,580 89,424
Less: Preferred stock dividendsÏÏÏÏÏÏÏÏÏÏÏÏÏÏÏÏÏÏÏÏÏÏÏÏÏÏÏ (12,963) Ì Ì Ì (12,963) Ì Ì Ì (12,963) Ì Ì (12,963)
Earnings (loss) available to common shareholders ÏÏÏÏÏÏÏÏÏÏ $ 76,113 $ 96,980 $ 20,155 $(117,135) $ 76,113 $ (9,710) $ 1,248 $ 8,462 $ 76,113 $(2,232) $ 2,580 $ 76,461
(a) Balances for the year ending December 31, 2004
(b) Eliminate intercompany lease and commission income
(c) Eliminate intercompany premiums
(d) Eliminate intercompany interest on debt
(e) Eliminate gain on sale of surplus property from U-Haul to SAC Holding II
(f) Eliminate equity earnings in subsidiaries and equity earnings in SAC Holding II
(g) Represents the Obligated Group
(h) Eliminate management fees charged to SAC Holding II and other intercompany operating expenses