U-Haul 2005 Annual Report Download - page 60
Download and view the complete annual report
Please find page 60 of the 2005 U-Haul annual report below. You can navigate through the pages in the report by either clicking on the pages listed below, or by using the keyword search tool below to find specific information within the annual report.-
 1
1 -
2
-
3
-
4
-
5
-
6
-
7
-
8
-
9
-
10
-
11
-
12
-
13
-
14
-
15
-
16
-
17
-
18
-
19
-
20
-
21
-
22
-
23
-
24
-
25
-
26
-
27
-
28
-
29
-
30
-
31
-
32
-
33
-
34
-
35
-
36
-
37
-
38
-
39
-
40
-
41
-
42
-
43
-
44
-
45
-
46
-
47
-
48
-
49
-
 50
50 -
 51
51 -
 52
52 -
 53
53 -
 54
54 -
 55
55 -
 56
56 -
 57
57 -
 58
58 -
 59
59 -
 60
60 -
 61
61 -
 62
62 -
 63
63 -
 64
64 -
 65
65 -
 66
66 -
 67
67 -
 68
68 -
 69
69 -
 70
70 -
71
-
72
-
73
-
74
-
75
-
76
-
77
-
78
-
79
-
80
-
81
-
82
-
83
-
84
-
85
-
86
-
87
-
88
-
89
-
90
-
91
-
92
-
93
-
94
-
95
-
96
-
97
-
98
-
99
-
100
-
101
-
102
-
103
 |
 |

59 I AMERCO ANNUAL REPORT
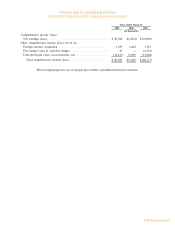
AMERCO AND CONSOLIDATED ENTITIES
NOTES TO CONSOLIDATED FINANCIAL STATEMENTS Ì (Continued)
Note 7: Investments
Held-to-Maturity Investments
Held-to-maturity investments at December 31, 2004 were as follows:
Gross Gross Estimated
Amortized Unrealized Unrealized Market
Cost Gains Losses Value
(In thousands)
U.S. treasury securities and government
obligations ÏÏÏÏÏÏÏÏÏÏÏÏÏÏÏÏÏÏÏÏÏÏÏÏÏÏÏÏÏÏÏÏ $ 566 $133 $Ì $ 699
Mortgage-backed securities ÏÏÏÏÏÏÏÏÏÏÏÏÏÏÏÏÏÏÏÏ 864 23 (2) 885
$1,430 $156 $(2) $1,584
Held-to-maturity investments at December 31, 2003 were as follows:
Gross Gross Estimated
Amortized Unrealized Unrealized Market
Cost Gains Losses Value
(In thousands)
U.S. treasury securities and government
obligations ÏÏÏÏÏÏÏÏÏÏÏÏÏÏÏÏÏÏÏÏÏÏÏÏÏÏÏÏÏÏÏÏ $ 522 $148 $Ì $ 670
Mortgage-backed securities ÏÏÏÏÏÏÏÏÏÏÏÏÏÏÏÏÏÏÏÏ 5,308 109 (2) 5,415
$5,830 $257 $(2) $6,085
The adjusted cost and estimated market value of held-to-maturity investments in debt securities at
December 31, 2004 and December 31, 2003, by contractual maturity, were as follows:
December 31, 2004 December 31, 2003
Estimated
Amortized Estimated Amortized Market
Cost Market Value Cost Value
(In thousands)
Due in one year or less ÏÏÏÏÏÏÏÏÏÏÏÏÏÏÏÏÏÏÏÏÏÏÏÏ $ Ì $ Ì $ Ì $ Ì
Due after one year through five years ÏÏÏÏÏÏÏÏÏÏÏÏ 260 287 240 283
Due after five years through ten years ÏÏÏÏÏÏÏÏÏÏÏÏ 220 285 219 294
After ten years ÏÏÏÏÏÏÏÏÏÏÏÏÏÏÏÏÏÏÏÏÏÏÏÏÏÏÏÏÏÏÏ 86 127 63 93
566 699 522 670
Mortgage-backed securities ÏÏÏÏÏÏÏÏÏÏÏÏÏÏÏÏÏÏÏÏÏ 864 885 5,308 5,415
$1,430 $1,584 $5,830 $6,085
Expected maturities may differ from contractual maturities as borrowers may have the right to call or
prepay obligations with or without call or prepayment penalties.
The company deposits bonds with insurance regulatory authorities to meet statutory requirements. The
adjusted cost of bonds on deposit with insurance regulatory authorities was $12.9 million at December 31,
2004 and $12.9 million at December 31, 2003.
F-16
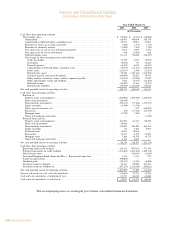
Note 6: Notes and Mortgage Receivables, Net
Notesandmortgagereceivablesatfiscalyear-endswereasfollows:
Note 7: Investments
Held-to-Maturity Investments
Held-to-maturityinvestmentsatDecember31,2004wereasfollows:
Held-to-maturityinvestmentsatDecember31,2003wereasfollows:
Theadjustedcostandestimatedmarketvalueofheld-to-maturityinvestmentsindebtsecuritiesatDecember31,2004
andDecember31,2003,bycontractualmaturity,wereasfollows:
AMERCO AND CONSOLIDATED ENTITIES
NOTES TO CONSOLIDATED FINANCIAL STATEMENTS Ì (Continued)
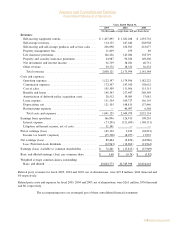
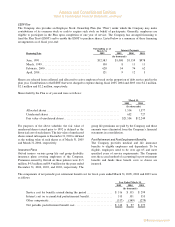
Note 4: Earnings Per Share
Net income for purposes of computing earnings per common share is net income minus preferred stock
dividends. Preferred stock dividends include accrued dividends of AMERCO.
The shares used in the computation of the Company's basic and diluted earnings per common share were
as follows:
Years Ended March 31,
2005 2004 2003
Basic and diluted earnings (loss) per common share $ 3.68 $ (0.76) $ (1.82)
Weighted average common share outstanding:
Basic and diluted ÏÏÏÏÏÏÏÏÏÏÏÏÏÏÏÏÏÏÏÏÏÏÏÏÏÏÏÏ 20,804,773 20,749,998 20,824,618
The weighted average common shares outstanding listed above exclude post-1992 shares of the employee
stock ownership plan that have not been committed to be released as of March 31, 2005, 2004, and 2003,
respectively.
6,100,000 shares of preferred stock have been excluded from the weighted average shares outstanding
calculation because they are not common stock and they are not convertible into common stock.
Note 5: Trade Receivables, Net
Trade receivables at fiscal year-ends were as follows:
March 31,
2005 2004
(In thousands)
Reinsurance recoverable ÏÏÏÏÏÏÏÏÏÏÏÏÏÏÏÏÏÏÏÏÏÏÏÏÏÏÏÏÏÏÏÏÏÏÏÏÏÏÏÏÏÏ $190,840 $180,481
Paid losses recoverable ÏÏÏÏÏÏÏÏÏÏÏÏÏÏÏÏÏÏÏÏÏÏÏÏÏÏÏÏÏÏÏÏÏÏÏÏÏÏÏÏÏÏÏ 15,764 25,418
Trade accounts receivable ÏÏÏÏÏÏÏÏÏÏÏÏÏÏÏÏÏÏÏÏÏÏÏÏÏÏÏÏÏÏÏÏÏÏÏÏÏÏÏÏÏ 9,847 5,080
Accrued investment income ÏÏÏÏÏÏÏÏÏÏÏÏÏÏÏÏÏÏÏÏÏÏÏÏÏÏÏÏÏÏÏÏÏÏÏÏÏÏÏ 7,703 9,645
Premiums and agents' balances ÏÏÏÏÏÏÏÏÏÏÏÏÏÏÏÏÏÏÏÏÏÏÏÏÏÏÏÏÏÏÏÏÏÏÏÏ 3,799 9,091
E&O Recovery receivableÏÏÏÏÏÏÏÏÏÏÏÏÏÏÏÏÏÏÏÏÏÏÏÏÏÏÏÏÏÏÏÏÏÏÏÏÏÏÏÏÏ 2,200 Ì
Independent dealer receivable ÏÏÏÏÏÏÏÏÏÏÏÏÏÏÏÏÏÏÏÏÏÏÏÏÏÏÏÏÏÏÏÏÏÏÏÏÏ 864 1,054
Other receivable ÏÏÏÏÏÏÏÏÏÏÏÏÏÏÏÏÏÏÏÏÏÏÏÏÏÏÏÏÏÏÏÏÏÏÏÏÏÏÏÏÏÏÏÏÏÏÏÏÏ 7,191 39,629
238,208 270,398
Less allowance for doubtful accounts ÏÏÏÏÏÏÏÏÏÏÏÏÏÏÏÏÏÏÏÏÏÏÏÏÏÏÏÏÏÏÏ (1,391) (2,012)
$236,817 $268,386
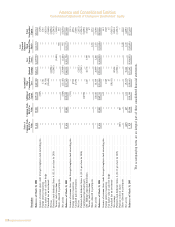
Note 6: Notes and Mortgage Receivables, Net
Notes and mortgage receivables at fiscal year-ends were as follows:
March 31,
2005 2004
(In thousands)
Notes, mortgage receivables and other, net of discount ÏÏÏÏÏÏÏÏÏÏÏÏÏÏÏÏÏÏ $ 4,589 $ 5,924
Less allowance for doubtful accounts ÏÏÏÏÏÏÏÏÏÏÏÏÏÏÏÏÏÏÏÏÏÏÏÏÏÏÏÏÏÏÏÏÏ (2,624) (2,624)
$ 1,965 $ 3,300
F-15
AMERCO AND CONSOLIDATED ENTITIES
NOTES TO CONSOLIDATED FINANCIAL STATEMENTS Ì (Continued)
Note 7: Investments
Held-to-Maturity Investments
Held-to-maturity investments at December 31, 2004 were as follows:
Gross Gross Estimated
Amortized Unrealized Unrealized Market
Cost Gains Losses Value
(In thousands)
U.S. treasury securities and government
obligations ÏÏÏÏÏÏÏÏÏÏÏÏÏÏÏÏÏÏÏÏÏÏÏÏÏÏÏÏÏÏÏÏ $ 566 $133 $Ì $ 699
Mortgage-backed securities ÏÏÏÏÏÏÏÏÏÏÏÏÏÏÏÏÏÏÏÏ 864 23 (2) 885
$1,430 $156 $(2) $1,584
Held-to-maturity investments at December 31, 2003 were as follows:
Gross Gross Estimated
Amortized Unrealized Unrealized Market
Cost Gains Losses Value
(In thousands)
U.S. treasury securities and government
obligations ÏÏÏÏÏÏÏÏÏÏÏÏÏÏÏÏÏÏÏÏÏÏÏÏÏÏÏÏÏÏÏÏ $ 522 $148 $Ì $ 670
Mortgage-backed securities ÏÏÏÏÏÏÏÏÏÏÏÏÏÏÏÏÏÏÏÏ 5,308 109 (2) 5,415
$5,830 $257 $(2) $6,085
The adjusted cost and estimated market value of held-to-maturity investments in debt securities at
December 31, 2004 and December 31, 2003, by contractual maturity, were as follows:
December 31, 2004 December 31, 2003
Estimated
Amortized Estimated Amortized Market
Cost Market Value Cost Value
(In thousands)
Due in one year or less ÏÏÏÏÏÏÏÏÏÏÏÏÏÏÏÏÏÏÏÏÏÏÏÏ $ Ì $ Ì $ Ì $ Ì
Due after one year through five years ÏÏÏÏÏÏÏÏÏÏÏÏ 260 287 240 283
Due after five years through ten years ÏÏÏÏÏÏÏÏÏÏÏÏ 220 285 219 294
After ten years ÏÏÏÏÏÏÏÏÏÏÏÏÏÏÏÏÏÏÏÏÏÏÏÏÏÏÏÏÏÏÏ 86 127 63 93
566 699 522 670
Mortgage-backed securities ÏÏÏÏÏÏÏÏÏÏÏÏÏÏÏÏÏÏÏÏÏ 864 885 5,308 5,415
$1,430 $1,584 $5,830 $6,085
Expected maturities may differ from contractual maturities as borrowers may have the right to call or
prepay obligations with or without call or prepayment penalties.
The company deposits bonds with insurance regulatory authorities to meet statutory requirements. The
adjusted cost of bonds on deposit with insurance regulatory authorities was $12.9 million at December 31,
2004 and $12.9 million at December 31, 2003.
F-16
Amerco and Consolidated Entities
Notes to Consolidated Financial Statements, continued