Tyson Foods 2000 Annual Report Download - page 9
Download and view the complete annual report
Please find page 9 of the 2000 Tyson Foods annual report below. You can navigate through the pages in the report by either clicking on the pages listed below, or by using the keyword search tool below to find specific information within the annual report.-
 1
1 -
 2
2 -
 3
3 -
 4
4 -
 5
5 -
 6
6 -
 7
7 -
 8
8 -
 9
9 -
 10
10 -
 11
11 -
 12
12 -
 13
13 -
 14
14 -
 15
15 -
 16
16 -
 17
17 -
 18
18 -
 19
19 -
 20
20 -
21
-
22
-
23
-
24
-
25
-
26
-
27
-
28
-
29
-
30
-
31
-
32
-
33
-
34
-
35
-
36
-
37
-
38
-
39
-
40
-
41
-
42
-
43
-
44
-
45
-
46
-
47
-
48
-
49
-
50
-
51
-
52
-
53
-
54
-
55
-
56
 |
 |

in millions, except per share data
2 0 0 0 1999 1998
Sales $7,158 $7,363 $7,414
Gross profit 1,114 1,309 1,154
Operating income 348 487 204
Income before taxes on income and minority interest 234 371 71
Provision for income taxes 83 129 46
Net income 151 230 25
Diluted earnings per share 0.67 1.00 0.11
Diluted earnings per share before asset impairment
and other charges 0.74 1.20 0.79
Asset impairment and other charges 24 77 215
Shareholders’ equity 2,175 2,128 1,970
Book value per share 9.67 9.31 8.53
Total assets 4,854 5,083 5,243
Depreciation and amortization 294 291 276
Total debt 1,542 1,804 2,129
Capital expenditures $ 196 $ 363 $ 310
Shares outstanding 225 229 231
Diluted average shares outstanding 226 231 228
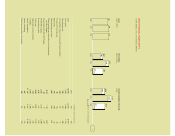
2000 FINANCIAL HIGHLIGHTS
TYSON FOODS, INC. 2000 ANNUAL REPORT
S A L E S
dollars in billions
NET INCOME
dollars in millions
DILUTED EARNINGS PER SHARE
dollars
2000 1999 1998 2000 1999 1998 2000 1999 1998
7. 4
7. 2 7. 4 277
180
167
1.20
1.00
0.67
25
0.79
0.74
0.11
before non-recurring charges
7
151
230