Tyson Foods 2000 Annual Report Download - page 46
Download and view the complete annual report
Please find page 46 of the 2000 Tyson Foods annual report below. You can navigate through the pages in the report by either clicking on the pages listed below, or by using the keyword search tool below to find specific information within the annual report.-
 1
1 -
2
-
3
-
4
-
5
-
6
-
7
-
8
-
9
-
10
-
11
-
12
-
13
-
14
-
15
-
16
-
17
-
18
-
19
-
20
-
21
-
22
-
23
-
24
-
25
-
26
-
27
-
28
-
29
-
30
-
31
-
32
-
33
-
34
-
35
-
 36
36 -
 37
37 -
 38
38 -
 39
39 -
 40
40 -
 41
41 -
 42
42 -
 43
43 -
 44
44 -
 45
45 -
 46
46 -
 47
47 -
 48
48 -
 49
49 -
 50
50 -
 51
51 -
 52
52 -
 53
53 -
 54
54 -
 55
55 -
 56
56
 |
 |

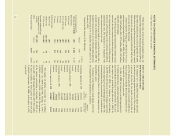
NOTES TO CONSOLIDATED FINANCIAL STATEMENTS
TYSON FOODS, INC. 2000 ANNUAL REPORT
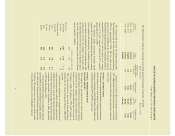
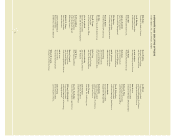
Information on segments and a reconciliation to income before taxes on income and minority interest are as follows:
in millions
Food Consumer
Service Products International Swine Seafood Other Consolidated
Fiscal year ended September 30, 2000
Sales $3,312 $2,250 $657 $157 – $ 782 $7,158
Gross profit less selling expenses 197 145 50 19 – 140 551
Other operating expenses 203
Other expense 114
Income before taxes on income
and minority interest 234
Depreciation 113 65 8 3 – 68 257
Identifiable assets 1,745 1,111 166 102 – 1,730 4,854
Additions to property, plant and equipment 42 68 8 – – 78 196
Fiscal year ended October 2, 1999
Sales $3,354 $2,252 $645 $110 $189 $ 813 $7,363
Gross profit less selling expenses 311 241 68 (63) 22 155 734
Other operating expenses 247
Other expense 116
Income before taxes on income
and minority interest 371
Depreciation 114 57 1 4 29 50 255
Asset impairment and other charges – – – 35 19 23 77
Identifiable assets 1,925 1,161 194 70 – 1,733 5,083
Additions to property, plant and equipment 153 130 16 4 6 54 363
Fiscal year ended October 3, 1998
Sales $3,329 $2,074 $593 $160 $214 $1,044 $7,414
Gross profit less selling expenses 232 179 9 (21) 3 110 512
Other operating expenses 308
Other expense 133
Income before taxes on income
and minority interest 71
Depreciation 108 62 1 4 23 45 243
Asset impairment and other charges 51 39 48 – 47 30 215
Identifiable assets 1,822 1,038 188 128 221 1,845 5,242
Additions to property, plant and equipment 154 69 – 5 27 55 310
44