Tyson Foods 2000 Annual Report Download - page 22
Download and view the complete annual report
Please find page 22 of the 2000 Tyson Foods annual report below. You can navigate through the pages in the report by either clicking on the pages listed below, or by using the keyword search tool below to find specific information within the annual report.-
 1
1 -
2
-
3
-
4
-
5
-
6
-
7
-
8
-
9
-
10
-
11
-
 12
12 -
 13
13 -
 14
14 -
 15
15 -
 16
16 -
 17
17 -
 18
18 -
 19
19 -
 20
20 -
 21
21 -
 22
22 -
 23
23 -
 24
24 -
 25
25 -
 26
26 -
 27
27 -
 28
28 -
 29
29 -
 30
30 -
 31
31 -
 32
32 -
33
-
34
-
35
-
36
-
37
-
38
-
39
-
40
-
41
-
42
-
43
-
44
-
45
-
46
-
47
-
48
-
49
-
50
-
51
-
52
-
53
-
54
-
55
-
56
 |
 |

MANAGEMENT’S DISCUSSION AND ANALYSIS
TYSON FOODS, INC. 2000 ANNUAL REPORT
RESULTS OF OPERATIONS Earnings for fiscal 2000 were
$151 million or $0.67 per share compared to $230 million
or $1.00 per share in fiscal 1999. Earnings in fiscal 2000
were adversely affected by an oversupply of chicken and a
$33 million charge on non-recurring items including a bad
debt writeoff related to AmeriServe and growout issues at
Tyson de Mexico. The Company’s accounting cycle resulted
in a 52-week year for both 2000 and 1999 compared to a
53-week year for 1998.
2000 vs. 1999
Sales for 2000 decreased 2.8% from sales for 1999. This
decrease is primarily due to the sale of the seafood business
on July 17, 1999, and other divested non-core businesses.
Comparable sales increased 0.6% on a volume increase of
0.3% compared to 1999. Additionally, the operating results
for 2000 were negatively affected by a weak domestic market
for chicken and reduced volume by the Company’s Mexican
subsidiary. In response to the oversupply of chicken, the
Company maintained throughout fiscal 2000 a 3% cut in
the number of chickens produced. Management anticipates
this oversupply of chicken to continue into fiscal 2001.
The Company presently identifies segments based on the
products offered and the nature of customers, resulting in
four reported business segments: Food Service, Consumer
Products, International and Swine. The Company’s seafood
business, which was sold on July 17, 1999, is listed as a busi-
ness segment for fiscal 1999 and 1998.
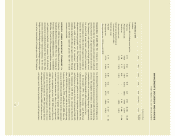
The following is an analysis of sales by segment:
dollars in millions
2000 1999 Change
Food Service $3,312 $3,354 $ (42)
Consumer Products 2,250 2,252 (2)
International 657 645 12
Swine 157 110 47
Seafood –189 (189)
Other 782 813 (31)
Tota l $7,158 $7,363 $(205)
Segment profit, defined as gross profit less selling
expenses, by segment is as follows:
dollars in millions
2000 1999 Change
Food Service $197 $311 $(114)
Consumer Products 145 241 (96)
International 50 68 (18)
Swine 19 (63) 82
Seafood –22 (22)
Other 140 155 (15)
Tota l $551 $734 $(183)
Food Service sales decreased $42 million or 1.3%
compared to 1999, with a 1.4% decrease in average sales
prices partially offset by a 0.2% increase in volume. Segment
profit for Food Service decreased $114 million or 36.7%
from 1999 primarily due to lower market prices, product
mix changes and higher grain costs. Food Service includes
fresh, frozen and value-added chicken products sold through
domestic foodservice, specialty and commodity distributors
who deliver to restaurants, schools and other accounts.
Consumer Products sales decreased $2 million or 0.1%
compared to 1999, with a 0.6% decrease in average sales prices
partially offset by a 0.6% increase in volume. Segment profit
for Consumer Products decreased $96 million or 39.7% from
1999 primarily due to lower market prices and higher grain
costs, which more than offset the improved product mix.
Consumer Products includes fresh, frozen and value-added
chicken products sold through domestic retail markets for
at-home consumption and through wholesale club markets
targeted to small foodservice operators, individuals and
small businesses.
International sales increased $12 million or 1.9% over
1999, with a 4.2% increase in average sales prices partially
offset by a 2.3% decrease in volume. International segment
profit decreased $18 million or 26.5% from 1999 primarily
due to losses incurred by the Company’s Mexican subsidiary
resulting from the outbreak of Exotic Newcastle disease
and associated decreases in production. The Newcastle
20