Tyson Foods 2000 Annual Report Download - page 25
Download and view the complete annual report
Please find page 25 of the 2000 Tyson Foods annual report below. You can navigate through the pages in the report by either clicking on the pages listed below, or by using the keyword search tool below to find specific information within the annual report.-
 1
1 -
2
-
3
-
4
-
5
-
6
-
7
-
8
-
9
-
10
-
11
-
12
-
13
-
14
-
 15
15 -
 16
16 -
 17
17 -
 18
18 -
 19
19 -
 20
20 -
 21
21 -
 22
22 -
 23
23 -
 24
24 -
 25
25 -
 26
26 -
 27
27 -
 28
28 -
 29
29 -
 30
30 -
 31
31 -
 32
32 -
 33
33 -
 34
34 -
 35
35 -
36
-
37
-
38
-
39
-
40
-
41
-
42
-
43
-
44
-
45
-
46
-
47
-
48
-
49
-
50
-
51
-
52
-
53
-
54
-
55
-
56
 |
 |

MANAGEMENT’S DISCUSSION AND ANALYSIS
TYSON FOODS, INC. 2000 ANNUAL REPORT
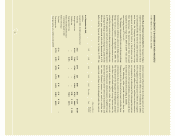
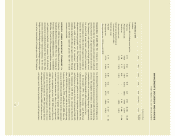
The following is an analysis of sales by segment:
dollars in millions
1999 1998 Change
Food Service $3,354 $3,329 $ 25
Consumer Products 2,252 2,074 178
International 645 592 53
Swine 110 161 (51)
Seafood 189 214 (25)
Other 813 1,044 (231)
Total $7,363 $7,414 $ (51)
Segment profit, defined as gross profit less selling
expenses, is as follows:
dollars in millions
1999 1998 Change
Food Service $311 $232 $ 79
Consumer Products 241 179 62
International 68 9 59
Swine (63) (21) (42)
Seafood 22 3 19
Other 155 110 45
Total $734 $512 $222
Food Service sales for 1999 increased $25 million or 0.8%
compared to 1998, with a 2.6% increase in volume primarily
offset by a 1.8% decrease in average sales prices. Segment
profit for Food Service increased $79 million over 1998 primar-
ily due to lower grain prices and a change in product mix.
Consumer Products sales for 1999 increased $178 million
or 8.6% compared to 1998. This increase was primarily due
to a 10.5% increase in volume partially offset by a 1.8%
decrease in average sales prices. Consumer Products segment
profit increased $62 million resulting from the increase in
volume and lower grain costs.
International sales for 1999 increased $53 million or 9%
compared to 1998. This increase is primarily the result of a
29.6% increase in volume partially offset by a 15.9% decrease
in average sales prices. Segment profit for International increased
$59 million. The increase in volume and segment profit for
the International segment is primarily due to the consolidation
of Tyson de Mexico.
Swine sales for 1999 decreased $51 million or 31.7%
compared to 1998. Swine segment loss increased $42 million.
The swine business experienced a significant decrease in mar-
ket prices during 1999 compared to 1998, resulting in a Swine
group net loss of $0.18 per share for 1999.
Seafood sales for 1999 decreased $25 million or 11.7%
compared to 1998. This decrease was primarily due to the
sale of the seafood business at the beginning of the fourth
quarter of 1999. Segment profit for Seafood increased
$19 million.
Other sales for 1999 decreased $231 million or 22.1%
compared to 1998, primarily due to the sale of non-core
businesses at the end of the first quarter of 1999. Other
segment profit increased $45 million.
Cost of sales for 1999 decreased 3.3% compared to 1998.
This decrease was primarily the result of decreased sales and
lower grain costs. As a percent of sales, cost of sales was
82.2% for 1999 compared to 84.4% for 1998 primarily due
to lower grain costs.
Operating expenses for 1999 decreased 13.5% from 1998,
primarily due to impairment and other charges of $77 million
in 1999 compared to $142 million in 1998. As a percent of
sales, selling expense decreased to 7.8% in 1999 compared to
8.7% in 1998, primarily due to the $48 million charge in 1998
for losses in the Company’s export business to Russia. General
and administrative expense, as a percent of sales, was 1.8% in
both 1999 and 1998. Amortization expense, as a percent of
sales, was 0.5% in 1999 compared to 0.4% in 1998.
23