Tyson Foods 2000 Annual Report Download - page 26
Download and view the complete annual report
Please find page 26 of the 2000 Tyson Foods annual report below. You can navigate through the pages in the report by either clicking on the pages listed below, or by using the keyword search tool below to find specific information within the annual report.-
 1
1 -
2
-
3
-
4
-
5
-
6
-
7
-
8
-
9
-
10
-
11
-
12
-
13
-
14
-
15
-
 16
16 -
 17
17 -
 18
18 -
 19
19 -
 20
20 -
 21
21 -
 22
22 -
 23
23 -
 24
24 -
 25
25 -
 26
26 -
 27
27 -
 28
28 -
 29
29 -
 30
30 -
 31
31 -
 32
32 -
 33
33 -
 34
34 -
 35
35 -
 36
36 -
37
-
38
-
39
-
40
-
41
-
42
-
43
-
44
-
45
-
46
-
47
-
48
-
49
-
50
-
51
-
52
-
53
-
54
-
55
-
56
 |
 |

MANAGEMENT’S DISCUSSION AND ANALYSIS
TYSON FOODS, INC. 2000 ANNUAL REPORT
Interest expense in 1999 decreased 10.9% compared to 1998.
As a percent of sales, interest expense was 1.7% in 1999
compared to 1.9% in 1998. The Company had a lower level
of borrowing in 1999, which decreased the Company’s aver-
age indebtedness by 6.4% from 1998. The Company’s short-
term interest rates were slightly lower than in 1998, and the
net average effective interest rate on total debt was 6.2% for
1999 compared to 6.6% for 1998.
The effective tax rate for 1999 was 34.9% compared to 64.7%
for 1998. The 1998 effective tax rate was affected by certain
costs related to asset impairment and foreign losses not
deductible for tax purposes.
Return on invested capital for 1999 was 10.9% compared to
4.9% for 1998.
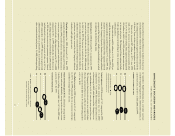
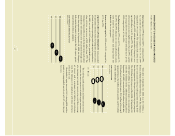
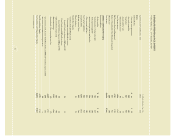
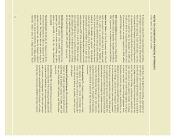
LIQUIDITY AND CAPITAL RESOURCES Cash provided
by operations continues to be the Company’s primary source
of funds to finance operating needs and capital expenditures.
In 2000, net cash of $587 million was provided by oper-
ating activities, an increase of $40 million from 1999. The
Company’s foreseeable cash needs for operations and capital
expenditures will continue to be met primarily through cash
flows from operations. At September 30, 2000, the Company
had construction projects in progress that will require approx-
imately $121 million to complete.
Total debt at September 30, 2000, was $1.5 billion, a
decrease of $262 million from October 2, 1999. The Company
has an unsecured revolving credit agreement totaling $1 bil-
lion that supports the Company’s commercial paper program.
This $1 billion facility expires in May 2002. At September 30,
2000, $260 million in commercial paper was outstanding
under this $1 billion facility. Additional outstanding debt at
September 30, 2000, consisted of $880 million of public debt,
$112 million of institutional notes, $155 million of leveraged
equipment loans, $62 million of notes payable and $73 million
of other indebtedness.
The revolving credit agreement and notes contain various
covenants, the more restrictive of which require maintenance
of a minimum net worth, current ratio, cash flow coverage
of interest and a maximum total debt-to-capitalization
ratio. The Company is in compliance with these covenants
at fiscal year end.
Shareholders’ equity increased 2.2% during 2000 and has
grown at a compounded annual rate of 8.2% over the past
five years.
24
’00
’99
’98
547
496
587
CASH PROVIDED BY OPERATING ACTIVITIES
dollars in millions
’00
’99
’98
2.2
2.1
2.0
2.1
1. 8
1.5
TOTAL CAPITALIZATION
dollars in billions
debt equity