Tyson Foods 2000 Annual Report Download - page 50
Download and view the complete annual report
Please find page 50 of the 2000 Tyson Foods annual report below. You can navigate through the pages in the report by either clicking on the pages listed below, or by using the keyword search tool below to find specific information within the annual report.-
 1
1 -
2
-
3
-
4
-
5
-
6
-
7
-
8
-
9
-
10
-
11
-
12
-
13
-
14
-
15
-
16
-
17
-
18
-
19
-
20
-
21
-
22
-
23
-
24
-
25
-
26
-
27
-
28
-
29
-
30
-
31
-
32
-
33
-
34
-
35
-
36
-
37
-
38
-
39
-
 40
40 -
 41
41 -
 42
42 -
 43
43 -
 44
44 -
 45
45 -
 46
46 -
 47
47 -
 48
48 -
 49
49 -
 50
50 -
 51
51 -
 52
52 -
 53
53 -
 54
54 -
 55
55 -
 56
56
 |
 |

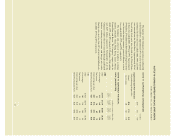
ELEVEN-YEAR FINANCIAL SUMMARY
TYSON FOODS, INC. 2000 ANNUAL REPORT
in millions, except per share data
2000 1999 1998 1997 1996 1995 1994 1993 1992 1991 1990
Summary of Operations
Sales $7,158 $7,363 $7,414 $6,356 $6,454 $5,511 $5,110 $4,707 $4,169 $3,922 $3,825
Cost of sales 6,044 6,054 6,260 5,318 5,506 4,423 4,149 3,797 3,390 3,148 3,082
Gross profit 1,114 1,309 1,154 1,038 948 1,088 961 911 779 775 744
Operating expenses 766 822 950 638 679 616 766 535 447 441 423
Interest expense 115 124 139 110 133 115 86 73 77 96 129
Provision for income taxes 83 129 46 144 49 131 121 129 101 97 80
Net income (loss) $ 151 $ 230 $ 25 $ 186 $ 87 $ 219 $ (2) $ 180 $ 161 $ 146 $ 120
Year end shares outstanding 225 229 231 213 217 217 218 221 206 206 205
Diluted average shares outstanding 226 231 228 218 218 218 222 223 208 207 199
Diluted earnings (loss) per share $ 0.67 $ 1.00 $ 0.11 $ 0.85 $ 0.40 $ 1.01 $ (0.01) $ 0.81 $ 0.77 $ 0.70 $ 0.60
Basic earnings (loss) per share 0.67 1.00 0.11 0.86 0.40 1.01 (0.01) 0.82 0.78 0.71 0.61
Dividends per share:
Class A 0.160 0.115 0.100 0.095 0.080 0.053 0.047 0.027 0.027 0.020 0.013
Class B 0.144 0.104 0.090 0.086 0.072 0.044 0.039 0.022 0.022 0.017 0.011
Depreciation and amortization $ 294 $ 291 $ 276 $ 230 $ 239 $ 205 $ 188 $ 177 $ 149 $ 136 $ 123
Balance Sheet Data
Capital expenditures $ 196 $ 363 $ 310 $ 291 $ 214 $ 347 $ 232 $ 225 $ 108 $ 214 $ 164
Total assets 4,854 5,083 5,242 4,411 4,544 4,444 3,668 3,254 2,618 2,646 2,501
Net property, plant and equipment 2,141 2,185 2,257 1,925 1,869 2,014 1,610 1,435 1,142 1,162 1,071
Total debt 1,542 1,804 2,129 1,690 1,975 1,985 1,455 1,024 826 984 1,021
Shareholders’ equity $2,175 $2,128 $1,970 $1,621 $1,542 $1,468 $1,289 $1,361 $ 980 $ 823 $ 663
Other Key Financial Measures
Return on sales 2.2% 3.1% 0.3% 2.9% 1.4% 4.0% 0.0% 3.8% 3.9% 3.7% 3.1%
Annual sales growth (decline) (2.8)% (0.7)% 16.7% (1.5)% 17.1% 7.9% 8.6% 12.9% 6.3% 2.5% 50.7%
Gross margin 15.6% 17.8% 15.6% 16.3% 14.7% 19.7% 18.8% 19.4% 18.7% 19.8% 19.4%
Return on invested capital 8.2% 10.9% 4.9% 10.2% 6.8% 13.3% 6.5% 14.8% 14.8% 15.4% 15.0%
Return on beginning
shareholders’ equity 7.1% 11.7% 1.5% 12.1% 5.9% 17.0% (0.2)% 18.4% 19.5% 22.0% 26.8%
Effective tax rate 35.6% 34.9% 64.7% 43.6% 37.0% 38.1% 101.8% 41.8% 38.5% 40.0% 40.0%
Total debt to capitalization 41.5% 45.9% 51.9% 51.0% 56.2% 57.5% 53.0% 42.9% 45.7% 54.5% 60.6%
Book value per share $9.67 $ 9.31 $ 8.53 $ 7.60 $ 7.09 $ 6.76 $ 5.92 $ 6.16 $ 4.75 $ 3.99 $ 3.24
Closing stock price high 18.00 25.38 24.44 23.63 18.58 18.17 16.67 18.08 15.08 15.58 11.79
Closing stock price low 8.56 15.00 16.50 17.75 13.83 13.83 12.50 12.83 10.17 8.46 7.17
1. Return on invested capital is defined as earnings before interest and taxes divided by average total assets less current liabilities excluding current debt.
2. The results for 2000 include a $24 million pretax charge for bad debt writeoff related to the January 31, 2000, bankruptcy filing of AmeriServe Food Distribution, Inc.
and a $9 million pretax charge related to Tyson de Mexico losses.
3. The results for 1999 include a $77 million pretax charge for loss on sale of assets and impairment write-downs.
4. Significant business combinations accounted for as purchases: Hudson Foods, Inc. and Arctic Alaska Fisheries Corporation on January 9, 1998 and October 5, 1992,
respectively. See Footnote 2 to the Consolidated Financial Statements for acquisitions during the three-year period ended September 30, 2000.
5. The results for 1998 include a $215 million pretax charge for asset impairment and other charges.
6. The results for 1997 include a $41 million pretax gain ($4 million aftertax) from the sale of the beef division assets.
7. The results for 1994 include a $214 million pretax charge ($205 million aftertax) due to the write-down of certain long-lived assets of Arctic Alaska Fisheries Corporation.
48