Tyson Foods 2000 Annual Report Download - page 6
Download and view the complete annual report
Please find page 6 of the 2000 Tyson Foods annual report below. You can navigate through the pages in the report by either clicking on the pages listed below, or by using the keyword search tool below to find specific information within the annual report.-
 1
1 -
 2
2 -
 3
3 -
 4
4 -
 5
5 -
 6
6 -
 7
7 -
 8
8 -
 9
9 -
 10
10 -
 11
11 -
 12
12 -
 13
13 -
 14
14 -
 15
15 -
 16
16 -
 17
17 -
18
-
19
-
20
-
21
-
22
-
23
-
24
-
25
-
26
-
27
-
28
-
29
-
30
-
31
-
32
-
33
-
34
-
35
-
36
-
37
-
38
-
39
-
40
-
41
-
42
-
43
-
44
-
45
-
46
-
47
-
48
-
49
-
50
-
51
-
52
-
53
-
54
-
55
-
56
 |
 |

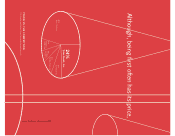
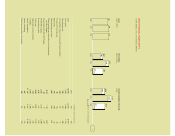
TYSON VS. THE COMPETITION
U.S. broiler production based on ready-to-cook pounds
9%
Gold Kist, Inc.
24%
Tyson Foods, Inc.
8%
Perdue Farms, Inc.
8%
ConAgra
Poultry Co.
6%
Pilgrim’s
Pride Corp.
45%
Rest of Industry
Although, being first often has its price,
Source: Watt Poultry U.S.A., January 2000