Tyson Foods 2000 Annual Report Download - page 23
Download and view the complete annual report
Please find page 23 of the 2000 Tyson Foods annual report below. You can navigate through the pages in the report by either clicking on the pages listed below, or by using the keyword search tool below to find specific information within the annual report.-
 1
1 -
2
-
3
-
4
-
5
-
6
-
7
-
8
-
9
-
10
-
11
-
12
-
 13
13 -
 14
14 -
 15
15 -
 16
16 -
 17
17 -
 18
18 -
 19
19 -
 20
20 -
 21
21 -
 22
22 -
 23
23 -
 24
24 -
 25
25 -
 26
26 -
 27
27 -
 28
28 -
 29
29 -
 30
30 -
 31
31 -
 32
32 -
 33
33 -
34
-
35
-
36
-
37
-
38
-
39
-
40
-
41
-
42
-
43
-
44
-
45
-
46
-
47
-
48
-
49
-
50
-
51
-
52
-
53
-
54
-
55
-
56
 |
 |

MANAGEMENT’S DISCUSSION AND ANALYSIS
TYSON FOODS, INC. 2000 ANNUAL REPORT
disease had been eradicated from our facilities by fiscal year
end and production volumes had returned to normal levels.
The Company’s International segment markets and sells the
full line of Tyson chicken products throughout the world.
Swine sales increased $47 million or 42.7% over 1999,
with a 56.5% increase in average sales prices partially offset
by an 8.3% decrease in volume. Swine segment profit improved
$82 million or 130.2% over 1999 primarily due to the increase
in average sales prices. The Company’s Swine segment includes
feeder pig finishing and marketing of swine to regional and
national packers.
Other sales decreased $31 million or 3.8% from 1999 pri-
marily due to non-core businesses sold during fiscal 1999. Other
segment profit decreased $15 million or 9.7% from 1999. The
majority of revenue included in the Other segment is derived
from the Company’s Specialty Products and Prepared Foods
groups and the Company’s wholly owned subsidiary involved
in supplying chicken breeding stock.
Cost of sales for 2000 decreased 0.2% as compared to 1999.
This decrease is primarily the result of decreased sales. As a
percent of sales, cost of sales was 84.4% for 2000 compared
to 82.2% for 1999. The increase in cost of sales as a percent
of sales was due to the weak domestic market for chicken, the
reduction in volume associated with the Company’s ongoing
production cut, losses incurred by the Company’s Mexican
subsidiary and higher grain costs.
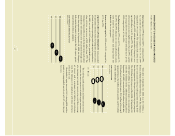
Operating expenses for 2000 decreased 6.8% from 1999,
primarily due to impairment and other charges of $77 million
recorded in 1999 partially offset by a $21 million increase in
current year expenses, primarily general and administrative.
As a percent of sales, selling expense increased to 7.9% in 2000
compared to 7.8% in 1999, primarily due to the decrease in
sales. Selling expense decreased $12 million in 2000 compared
to 1999 due to a decrease in sales promotion expenses. General
and administrative expense, as a percent of sales, was 2.4% in
2000 compared to 1.8% in 1999. The increase in general and
administrative expense is primarily due to a $24 million bad
debt writeoff related to the January 31, 2000, bankruptcy filing
by AmeriServe Food Distribution, Inc. and other increases
related to ongoing litigation costs. Amortization expense, as
a percent of sales, was 0.5% in both 2000 and 1999.
Interest expense in 2000 decreased 7.3% compared to 1999.
As a percent of sales, interest expense was 1.6% in 2000
compared to 1.7% in 1999. The Company had a lower level
of borrowing in 2000, which decreased the Company’s aver-
age indebtedness by 14.8% over the same period last year.
The Company’s short-term interest rates were slightly higher
than the same period last year, and the net average effective
interest rate on total debt was 6.9% for 2000 compared to
6.2% for 1999.
The effective tax rate for 2000 increased to 35.6% compared
to 34.9% for 1999 primarily due to an increase in foreign
subsidiary earnings effective tax rate.
Return on invested capital (ROIC), defined as earnings before
interest and taxes divided by average total assets less current
liabilities excluding current debt, was 8.2% for 2000 com-
pared to 10.9% for 1999.
21
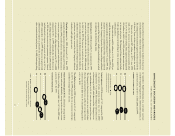
’00
’99
’98
7.9%
7.8%
8.0%**
1.8%
1.8%
2.0%*
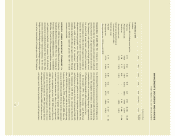
EXPENSES AS A PERCENT OF SALES
general & administrative selling
*Excludes $24 million bad debt writeoff
**Excludes $48 million impairment loss
’00
’99
’98 4.9%
12.6%
10.9%
8.7%
9.9%
8.2%
RETURN ON INVESTED CAPITAL
ROIC ROIC excluding bad debt charge of $24 million
in 2000 and impairment and other charges
of $77 million in 1999 and $211 million in 1998