Tyson Foods 2000 Annual Report Download - page 47
Download and view the complete annual report
Please find page 47 of the 2000 Tyson Foods annual report below. You can navigate through the pages in the report by either clicking on the pages listed below, or by using the keyword search tool below to find specific information within the annual report.-
 1
1 -
2
-
3
-
4
-
5
-
6
-
7
-
8
-
9
-
10
-
11
-
12
-
13
-
14
-
15
-
16
-
17
-
18
-
19
-
20
-
21
-
22
-
23
-
24
-
25
-
26
-
27
-
28
-
29
-
30
-
31
-
32
-
33
-
34
-
35
-
36
-
 37
37 -
 38
38 -
 39
39 -
 40
40 -
 41
41 -
 42
42 -
 43
43 -
 44
44 -
 45
45 -
 46
46 -
 47
47 -
 48
48 -
 49
49 -
 50
50 -
 51
51 -
 52
52 -
 53
53 -
 54
54 -
 55
55 -
 56
56
 |
 |

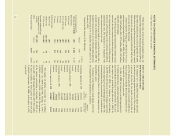
NOTES TO CONSOLIDATED FINANCIAL STATEMENTS
TYSON FOODS, INC. 2000 ANNUAL REPORT
The majority of the Company’s operations are domiciled
in the United States. Approximately 97% of sales to external
customers for the fiscal years ended 2000, 1999 and 1998
were sourced from the United States. Approximately $3 bil-
lion of long-lived assets were located in the United States
at fiscal years ended 2000, 1999 and 1998. Approximately
$74 million, $74 million and $64 million of long-lived assets
were located in foreign countries, primarily Mexico, at fiscal
years ended 2000, 1999 and 1998, respectively.
The Company sells certain of its products in foreign
markets, primarily China, Hong Kong, Japan, Mexico,
Puerto Rico and Russia. The Company’s export sales for
2000, 1999 and 1998 totaled $550 million, $546 million
and $687 million, respectively. Substantially all of the
Company’s export sales are transacted through unaffiliated
brokers, marketing associations and foreign sales staffs.
Foreign sales were less than 10% of total consolidated sales
for 2000, 1999 and 1998, respectively.
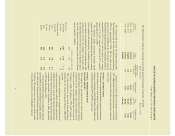
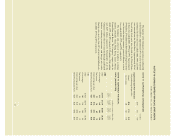
NOTE 17: SUPPLEMENTAL INFORMATION
in millions
2000 1999 1998
Supplemental Cash Flow Information
Cash paid during the period for:
Interest $116 $128 $160
Income taxes 73 125 197
NOTE 18: QUARTERLY FINANCIAL
DATA (UNAUDITED)
in millions, except per share data
First Second Third Fourth
quarter quarter quarter quarter
2000
Sales $1,779 $1,791 $1,807 $1,781
Gross margin 313 297 269 235
Net income 57 36 40 18
Basic earnings per share 0.25 0.16 0.18 0.08
Diluted earnings per share 0.25 0.16 0.18 0.08
1999
Sales $1,825 $1,841 $1,881 $1,816
Gross margin 306 322 350 331
Net income 56 65 68 41
Basic earnings per share 0.24 0.28 0.30 0.18
Diluted earnings per share 0.24 0.28 0.30 0.18
45