Tyson Foods 2000 Annual Report Download - page 28
Download and view the complete annual report
Please find page 28 of the 2000 Tyson Foods annual report below. You can navigate through the pages in the report by either clicking on the pages listed below, or by using the keyword search tool below to find specific information within the annual report.-
 1
1 -
2
-
3
-
4
-
5
-
6
-
7
-
8
-
9
-
10
-
11
-
12
-
13
-
14
-
15
-
16
-
17
-
 18
18 -
 19
19 -
 20
20 -
 21
21 -
 22
22 -
 23
23 -
 24
24 -
 25
25 -
 26
26 -
 27
27 -
 28
28 -
 29
29 -
 30
30 -
 31
31 -
 32
32 -
 33
33 -
 34
34 -
 35
35 -
 36
36 -
 37
37 -
 38
38 -
39
-
40
-
41
-
42
-
43
-
44
-
45
-
46
-
47
-
48
-
49
-
50
-
51
-
52
-
53
-
54
-
55
-
56
 |
 |

MANAGEMENT’S DISCUSSION AND ANALYSIS
TYSON FOODS, INC. 2000 ANNUAL REPORT
Interest Rate and Foreign Currency Risks The Company hedges
exposure to changes in interest rates on certain of its finan-
cial instruments. Under the terms of various leveraged equip-
ment loans, the Company enters into interest rate swap
agreements to effectively lock in a fixed interest rate for
these borrowings. The maturity dates of these leveraged
equipment loans range from 2005 to 2008 with interest
rates ranging from 4.7% to 6%.
The Company also periodically enters into foreign exchange
forward contracts and option contracts to hedge some of its
foreign currency exposure. At September 30, 2000, the
Company did not have any outstanding instruments or trans-
actions that are sensitive to foreign currency exchange rates.
In 1999, the Company used such contracts to hedge exposure
to changes in foreign currency exchange rates, primarily the
Mexican peso, associated with debt denominated in U.S.
dollars held by Tyson de Mexico. At October 2, 1999, the
notional amount of these forward exchange contracts to sell
Mexican pesos for U.S. dollars was $7 million due in 2000,
with a weighted average strike price of $10.13 and a negative
fair value of $1 million. Gains and losses on these contracts
are recognized as an adjustment of the subsequent transaction
when it occurs. Forward and option contracts generally have
maturities or expirations not exceeding 12 months.
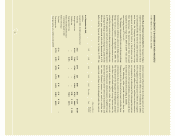
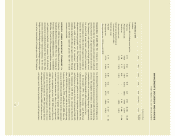
The following tables provide information about the
Company’s derivative financial instruments and other finan-
cial instruments that are sensitive to changes in interest rates.
The tables present the Company’s debt obligations, principal
cash flows and related weighted average interest rates by
expected maturity dates and fair values. For interest rate
swaps, the tables present notional amounts, weighted average
interest rates or strike rates by contractual maturity dates and
fair values. Notional amounts are used to calculate the
contractual cash flows to be exchanged under the contract.
dollars in millions
Fair value
2001 2002 2003 2004 2005 Thereafter Total 9/30/00
As of September 30, 2000
Liabilities
Long-term debt, including current portion
Fixed rate $123 $ 31 $178 $29 $180 $613 $1,154 $1,104
Average interest rate 8.23% 7.84% 6.18% 7.09% 6.80% 6.78% 6.88%
Variable rate – $276 – – – $ 50 $ 326 $ 326
Average interest rate – 6.78% – – – 5.64% 6.61%
Interest rate derivative financial
instruments related to debt
Interest rate swaps
Pay fixed $ 18 $ 20 $ 22 $21 $ 16 $ 13 $ 110 –
Average pay rate 6.72% 6.73% 6.73% 6.71% 6.44% 6.60% 6.66%
Average receive rate– USD 6 month LIBOR
26