Toyota 2011 Annual Report Download - page 93
Download and view the complete annual report
Please find page 93 of the 2011 Toyota annual report below. You can navigate through the pages in the report by either clicking on the pages listed below, or by using the keyword search tool below to find specific information within the annual report.-
 1
1 -
2
-
3
-
4
-
5
-
6
-
7
-
8
-
9
-
10
-
11
-
12
-
13
-
14
-
15
-
16
-
17
-
18
-
19
-
20
-
21
-
22
-
23
-
24
-
25
-
26
-
27
-
28
-
29
-
30
-
31
-
32
-
33
-
34
-
35
-
36
-
37
-
38
-
39
-
40
-
41
-
42
-
43
-
44
-
45
-
46
-
47
-
48
-
49
-
50
-
51
-
52
-
53
-
54
-
55
-
56
-
57
-
58
-
59
-
60
-
61
-
62
-
63
-
64
-
65
-
66
-
67
-
68
-
69
-
70
-
71
-
72
-
73
-
74
-
75
-
76
-
77
-
78
-
79
-
80
-
81
-
82
-
 83
83 -
 84
84 -
 85
85 -
 86
86 -
 87
87 -
 88
88 -
 89
89 -
 90
90 -
 91
91 -
 92
92 -
 93
93 -
 94
94 -
 95
95 -
 96
96 -
 97
97 -
 98
98 -
 99
99 -
 100
100 -
 101
101 -
 102
102 -
 103
103 -
104
-
105
-
106
-
107
-
108
-
109
-
110
-
111
-
112
-
113
 |
 |

0822
Financial Section and
Investor Information
Business and
Performance Review
Special FeatureMessage/Vision
Management and
Corporate Information
Notes to Consolidated Financial Statements
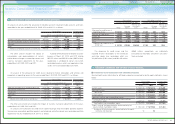
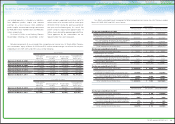
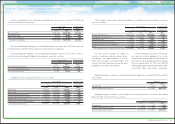
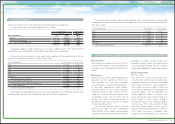
Amounts recognized in accumulated other comprehensive income (loss) as of March 31, 2010 and
2011 are comprised of the following:
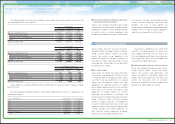
Other changes in plan assets and benefit obligations recognized in other comprehensive income
(loss) are as follows:
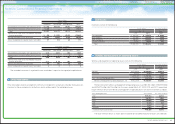
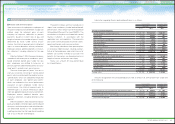
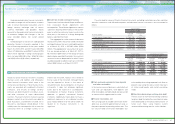
Weighted-average assumptions used to determine benefit obligations as of March 31, 2010 and 2011
are as follows:
Weighted-average assumptions used to determine net periodic pension cost for the years ended
March 31, 2009, 2010 and 2011 are as follows:
The accumulated benefit obligation for all defined benefit pension plans was ¥1,571,061 million and
¥1,584,627 million ($19,057 million) at March 31, 2010 and 2011, respectively.
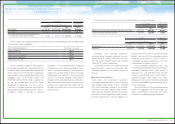
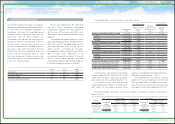
The projected benefit obligation, accumulated benefit obligation and fair value of plan assets for
which the accumulated benefit obligations exceed plan assets are as follows:
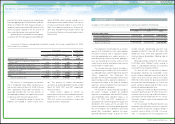
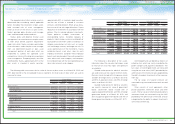
Components of the net periodic pension cost are as follows:
Yen in millions
U.S. dollars in millions
March 31, March 31,
2010 2011 2011
Net actuarial loss ¥(385,266) ¥(347,494) $(4,179)
Prior service costs 97,587 72,324 870
Net transition obligation (3,570) (1,626) (20)
Net amount recognized ¥(291,249) ¥(276,796) $(3,329)
Yen in millions
U.S. dollars in millions
March 31, March 31,
2010 2011 2011
Projected benefit obligation ¥508,501 ¥500,046 $6,014
Accumulated benefit obligation 452,019 453,111 5,449
Fair value of plan assets 65,905 72,359 870
Yen in millions
U.S. dollars in millions
For the years ended March 31,
For the year
ended March 31,
2009 2010 2011 2011
Service cost ¥ 84,206 ¥ 75,558 ¥ 82,422 $ 991
Interest cost 52,959 50,559 52,502 631
Expected return on plan assets (43,053) (32,251) (42,364) (509)
Amortization of prior service costs (17,677) (15,063) (24,032) (289)
Recognized net actuarial loss 5,752 27,246 16,095 194
Amortization of net transition obligation 1,944 1,944 1,944 23
Net periodic pension cost ¥ 84,131 ¥107,993 ¥ 86,567 $1,041
Yen in millions
U.S. dollars in millions
For the years ended March 31,
For the year
ended March 31,
2009 2010 2011 2011
Net actuarial gain (loss) ¥(303,074) ¥ 81,949 ¥(21,978) $(264)
Recognized net actuarial loss 5,752 27,246 16,095 194
Prior service costs 2,096 3,080 1,429 17
Amortization of prior service costs (17,677) (15,063) (24,032) (289)
Amortization of net transition obligation 1,944 1,944 1,944 23
Other 17,003 2,594 40,995 493
Total recognized in other comprehensive income (loss)
¥(293,956) ¥101,750 ¥ 14,453 $ 174
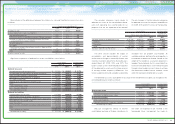
The other amount includes the impact of
transition to defined contribution pension plans,
consolidation and deconsolidation of certain
entities due to changes in ownership interest and
currency translation adjustments during the years
ended March 31, 2009, 2010 and 2011.
The estimated prior service costs, net actuarial
loss and net transition obligations that will be
amortized from accumulated other comprehensive
income (loss) into net periodic pension cost during
the year ending March 31, 2012 are ¥(15,700)
million ($(189) million), ¥16,000 million ($192 million)
and ¥1,900 million ($23 million), respectively.
March 31,
2010 2011
Discount rate 2.8% 2.8%
Rate of compensation increase 0.5-10.0% 0.8-11.0%
For the years ended March 31,
2009 2010 2011
Discount rate 2.8% 2.8% 2.8%
Expected return on plan assets 3.6% 3.6% 3.8%
Rate of compensation increase 0.1-10.0% 0.1-10.0% 0.5-10.0%
93
TOYOTA ANNUAL REPORT 2011