Toyota 2011 Annual Report Download - page 60
Download and view the complete annual report
Please find page 60 of the 2011 Toyota annual report below. You can navigate through the pages in the report by either clicking on the pages listed below, or by using the keyword search tool below to find specific information within the annual report.-
 1
1 -
2
-
3
-
4
-
5
-
6
-
7
-
8
-
9
-
10
-
11
-
12
-
13
-
14
-
15
-
16
-
17
-
18
-
19
-
20
-
21
-
22
-
23
-
24
-
25
-
26
-
27
-
28
-
29
-
30
-
31
-
32
-
33
-
34
-
35
-
36
-
37
-
38
-
39
-
40
-
41
-
42
-
43
-
44
-
45
-
46
-
47
-
48
-
49
-
 50
50 -
 51
51 -
 52
52 -
 53
53 -
 54
54 -
 55
55 -
 56
56 -
 57
57 -
 58
58 -
 59
59 -
 60
60 -
 61
61 -
 62
62 -
 63
63 -
 64
64 -
 65
65 -
 66
66 -
 67
67 -
 68
68 -
 69
69 -
 70
70 -
71
-
72
-
73
-
74
-
75
-
76
-
77
-
78
-
79
-
80
-
81
-
82
-
83
-
84
-
85
-
86
-
87
-
88
-
89
-
90
-
91
-
92
-
93
-
94
-
95
-
96
-
97
-
98
-
99
-
100
-
101
-
102
-
103
-
104
-
105
-
106
-
107
-
108
-
109
-
110
-
111
-
112
-
113
 |
 |

0822
Financial Section and
Investor Information
Business and
Performance Review
Special FeatureMessage/Vision
Management and
Corporate Information
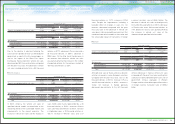
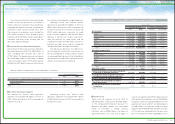
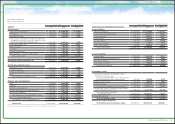
Management's Discussion and Analysis of Financial Condition and Results of Operations
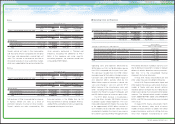
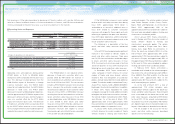
Japan
North America Europe
Yen in millions
2010 vs. 2009
Change
Changes in operating income and loss:
Effect of decrease in production
volume and vehicle unit sales in
the exported markets and other
operational factors ¥(325,000)
Effect of cost reduction efforts,
decrease in fixed costs and
other efforts 337,289
Total ¥ 12,289
The decrease in operating losses in Japan was
mainly due to the ¥460.0 billion impact of cost
reduction efforts, the ¥230.0 billion decrease in fixed
costs and other efforts in the automotive operations
segment, partially offset by the ¥330.0 billion impact
of decreases in both production volume and vehicle
unit sales in the export markets and the ¥330.0 billion
effects of changes in exchange rates. The decreases
in both production volume and vehicle unit sales in
the export markets are attributable to the difficult
market conditions particularly in North America and
Europe.
The increase in operating income in North
America was due mainly to the ¥270.0 billion
increase in operating income in the financial
services operations including the ¥150.0 billion
decrease in the provision for credit losses and net
charge-offs and the ¥50.0 billion decrease in the
provision for residual value losses of sales finance
subsidiaries in the United States, the ¥130.0 billion
decrease in fixed costs, the ¥50.0 billion impact
of cost reduction efforts, and other efforts, partially
offset by the ¥40.0 billion impact of decreases in
both production volume and vehicle unit sales
and the ¥4.1 billion impact of the fluctuations in
foreign currency translation rates. The decreases
in both production volume and vehicle unit sales
in North America are attributable to the substantial
decline in vehicle unit sales by 453 thousand
vehicles of commercial vehicles and passenger
vehicles due to the downturn in the market in the
first half of fiscal 2010.
The decrease in operating loss in Europe was
mainly due to the ¥110.0 billion decrease in fixed
costs and the ¥10.0 billion impact of cost reduction
efforts in the automotive operations, the ¥10.0
billion increase in operating income in the financial
services business, the ¥4.9 billion impact of
fluctuations in foreign currency translation rates,
and other efforts, partially offset by the ¥60.0
billion decrease of both production volume and
vehicle unit sales. The decreases in both
production volume and vehicle unit sales in
Europe was attributable to the decline in vehicle
unit sales by 204 thousand vehicles in the overall
European market compared to the prior fiscal
year despite sales growth in some of the countries
that benefited from government stimulus
packages.
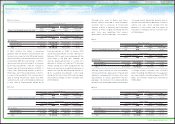
Yen in millions
2010 vs. 2009
Change
Changes in operating income and loss:
Effect of decrease in production
volume and vehicle unit sales and
other operational factors ¥ (30,000)
Effect of fluctuation in foreign
currency translation rates (4,100)
Effect of cost reduction efforts,
decrease in fixed costs and other
efforts 509,782
Total ¥ 475,682
Yen in millions
2010 vs. 2009
Change
Changes in operating income and loss:
Effect of decrease in production
volume and vehicle unit sales and
other operational factors ¥ (60,000)
Effect of fluctuation in foreign
currency translation rates 4,900
Effect of cost reduction efforts,
decrease in fixed costs and
other efforts 165,378
Total ¥110,278
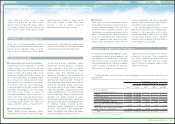
Toyota’s operating income increased by ¥608.5
billion to an operating income of ¥147.5 billion
during fiscal 2010 compared with the prior year.
This operating income was favorably impacted by
the effects of a ¥799.7 billion cost reduction efforts,
decrease in fixed costs and other efforts, the ¥178.7
billion decrease in research and development
expenses, and the ¥23.7 billion increase in parts
sales, partially offset by the ¥380.0 billion decrease
in vehicle unit sales and the changes in sales mix.
The effect of cost reduction efforts, decrease in
fixed costs and other efforts was favorably impacted
by the ¥520.0 billion effect of cost reduction efforts,
the ¥291.3 billion decrease in fixed costs and other
efforts excluding decrease in research and
development expenses and the ¥270.0 billion
increase in operating income in the financial
services business, partially offset by the ¥320.0
billion effects of changes in exchange rates. The
cost reduction efforts, decrease in fixed costs
and other efforts were also partially offset by the
¥105.7 billion increase in costs resulting from a
change in the estimation model of expenses related
to future recalls and other safety measures.
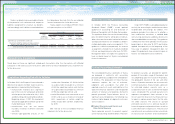
During fiscal 2010, operating income (before
the elimination of intersegment profits), increased
by ¥475.6 billion in North America, increased by
¥27.5 billion, or 15.6%, in Asia, and increased by
¥27.9 billion, or 31.9%, in Other compared with
the prior fiscal year. During fiscal 2010, operating
loss (before the elimination of intersegment profits)
decreased by ¥12.3 billion in Japan and
decreased by ¥110.3 billion in Europe compared
with the prior fiscal year.
The following is a discussion of operating
income and loss in each geographic market.
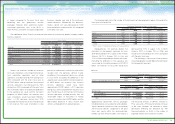
Operating Income and Loss
Yen in millions
2010 vs. 2009
Change
Changes in operating income and loss:
Effect
of decrease in vehicle unit
sales and changes in sales mix
and other operational factors
¥(370,000)
Effect of increase in parts sales 23,700
Effect of fluctuation in foreign
currency translation rates (23,600)
Effect of decrease in research and
development expenses 178,700
Effect of cost reduction efforts,
decrease in fixed costs and
other efforts 799,727
Total ¥ 608,527
60
TOYOTA ANNUAL REPORT 2011