Toyota 2011 Annual Report Download - page 81
Download and view the complete annual report
Please find page 81 of the 2011 Toyota annual report below. You can navigate through the pages in the report by either clicking on the pages listed below, or by using the keyword search tool below to find specific information within the annual report.-
 1
1 -
2
-
3
-
4
-
5
-
6
-
7
-
8
-
9
-
10
-
11
-
12
-
13
-
14
-
15
-
16
-
17
-
18
-
19
-
20
-
21
-
22
-
23
-
24
-
25
-
26
-
27
-
28
-
29
-
30
-
31
-
32
-
33
-
34
-
35
-
36
-
37
-
38
-
39
-
40
-
41
-
42
-
43
-
44
-
45
-
46
-
47
-
48
-
49
-
50
-
51
-
52
-
53
-
54
-
55
-
56
-
57
-
58
-
59
-
60
-
61
-
62
-
63
-
64
-
65
-
66
-
67
-
68
-
69
-
70
-
 71
71 -
 72
72 -
 73
73 -
 74
74 -
 75
75 -
 76
76 -
 77
77 -
 78
78 -
 79
79 -
 80
80 -
 81
81 -
 82
82 -
 83
83 -
 84
84 -
 85
85 -
 86
86 -
 87
87 -
 88
88 -
 89
89 -
 90
90 -
 91
91 -
92
-
93
-
94
-
95
-
96
-
97
-
98
-
99
-
100
-
101
-
102
-
103
-
104
-
105
-
106
-
107
-
108
-
109
-
110
-
111
-
112
-
113
 |
 |

Finance receivables:
7
0822
Financial Section and
Investor Information
Business and
Performance Review
Special FeatureMessage/Vision
Management and
Corporate Information
Notes to Consolidated Financial Statements
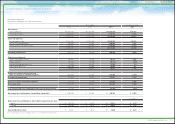
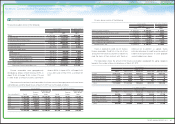
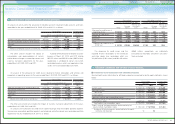
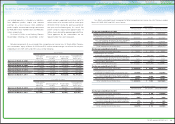
Finance receivables consist of the following:
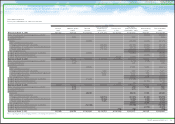
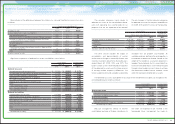
Finance leases consist of the following:
Yen in millions
U.S. dollars in millions
March 31, March 31,
2010 2011 2011
Retail ¥ 7,162,082 ¥ 7,128,453 $ 85,730
Finance leases 1,232,508 1,123,188 13,508
Wholesale and other dealer loans 2,051,301 1,990,557 23,939
10,445,891 10,242,198 123,177
Deferred origination costs 109,747 104,391 1,256
Unearned income
(
482,983) (496,235) (5,968)
Allowance for credit losses
Retail
(
160,351)
(
92,199) (1,109)
Finance leases
(
36,917)
(
36,024) (433)
Wholesale and other dealer loans
(
35,211)
(
28,580) (344)
Total allowance for credit losses
(
232,479)
(
156,803) (1,886)
Total finance receivables, net 9,840,176 9,693,551 116,579
Less - Current portion
(
4,209,496)
(
4,136,805) (49,751)
Noncurrent finance receivables, net ¥ 5,630,680 ¥ 5,556,746 $ 66,828
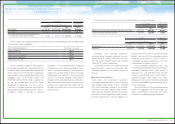
Finance receivables were geographically
distributed as follows: in North America 61.9%, in
Japan 12.8%, in Europe 10.3%, in Asia 4.7% and
in Other 10.3% as of March 31, 2010, and in North
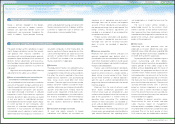
Toyota is exposed to credit risk on Toyota’s
finance receivables. Credit risk is the risk of loss
arising from the failure of customers or dealers to
meet the terms of their contracts with Toyota or
America 59.0%, in Japan 12.7%, in Europe 10.4%,
in Asia 5.8% and in Other 12.1% as of March 31,
2011.
otherwise fail to perform as agreed. Toyota
estimates allowance for credit losses by variety of
credit-risk evaluation process to cover probable
and estimable losses above.
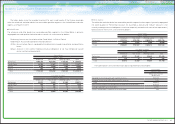
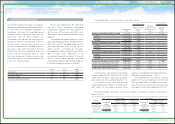
The contractual maturities of retail receivables, the future minimum lease payments on finance leases
and wholesale and other dealer loans at March 31, 2011 are summarized as follows:
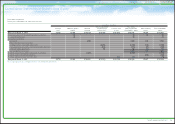
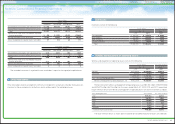
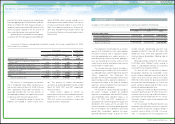
The table below shows the amount of the finance receivables segregated into aging categories
based on the number of days outstanding as of March 31, 2011:
Yen in millions U.S. dollars in millions
Years ending March 31,
Retail
Finance
leases
Wholesale and
other dealer
loans Retail
Finance
leases
Wholesale and
other dealer
loans
2012 ¥2,429,001 ¥326,116 ¥1,529,447 $29,212 $3,922 $18,394
2013 1,758,024 216,387 106,809 21,143 2,602 1,284
2014 1,343,998 165,018 153,470 16,164 1,985 1,846
2015 911,785 62,632 52,361 10,966 753 630
2016 444,633 28,095 59,945 5,347 338 721
Thereafter 241,012 6,623 88,525 2,898 80 1,064
¥7,128,453 ¥804,871 ¥1,990,557 $85,730 $9,680 $23,939
Yen in millions
U.S. dollars in millions
March 31, March 31,
2010 2011 2011
Minimum lease payments ¥ 903,201 ¥ 804,871 $ 9,680
Estimated unguaranteed residual values 329,307 318,317 3,828
1,232,508 1,123,188 13,508
Deferred origination costs 6,423 5,406 65
Less - Unearned income (121,664) (104,419) (1,256)
Less - Allowance for credit losses (36,917) (36,024) (433)
Finance leases, net ¥1,080,350 ¥ 988,151 $11,884
Yen in millions
March 31, 2011
Retail
Finance leases
Wholesale Real estate Working capital
Current ¥7,017,171 ¥1,111,453 ¥897,971 ¥494,700 ¥593,516
31-60 days past due 72,082 5,968 2,260 404 44
61-90 days past due 15,466 1,283 355 34 0
Over 90 days past due 23,734 4,484 74 621 578
Total ¥7,128,453 ¥1,123,188 ¥900,660 ¥495,759 ¥594,138
U.S. dollars in millions
March 31, 2011
Retail
Finance leases
Wholesale Real estate Working capital
Current $84,392 $13,367 $10,799 $5,950 $7,138
31-60 days past due 867 72 27 5 1
61-90 days past due 186 15 4 0 0
Over 90 days past due 285 54 1 7 7
Total $85,730 $13,508 $10,831 $5,962 $7,146
81
TOYOTA ANNUAL REPORT 2011