Toyota 2011 Annual Report Download - page 43
Download and view the complete annual report
Please find page 43 of the 2011 Toyota annual report below. You can navigate through the pages in the report by either clicking on the pages listed below, or by using the keyword search tool below to find specific information within the annual report.-
 1
1 -
2
-
3
-
4
-
5
-
6
-
7
-
8
-
9
-
10
-
11
-
12
-
13
-
14
-
15
-
16
-
17
-
18
-
19
-
20
-
21
-
22
-
23
-
24
-
25
-
26
-
27
-
28
-
29
-
30
-
31
-
32
-
 33
33 -
 34
34 -
 35
35 -
 36
36 -
 37
37 -
 38
38 -
 39
39 -
 40
40 -
 41
41 -
 42
42 -
 43
43 -
 44
44 -
 45
45 -
 46
46 -
 47
47 -
 48
48 -
 49
49 -
 50
50 -
 51
51 -
 52
52 -
 53
53 -
54
-
55
-
56
-
57
-
58
-
59
-
60
-
61
-
62
-
63
-
64
-
65
-
66
-
67
-
68
-
69
-
70
-
71
-
72
-
73
-
74
-
75
-
76
-
77
-
78
-
79
-
80
-
81
-
82
-
83
-
84
-
85
-
86
-
87
-
88
-
89
-
90
-
91
-
92
-
93
-
94
-
95
-
96
-
97
-
98
-
99
-
100
-
101
-
102
-
103
-
104
-
105
-
106
-
107
-
108
-
109
-
110
-
111
-
112
-
113
 |
 |

0822
Financial Section and
Investor Information
Business and
Performance Review
Special FeatureMessage/Vision
Management and
Corporate Information
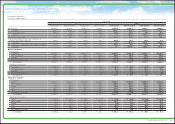
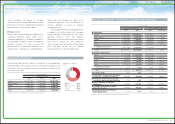
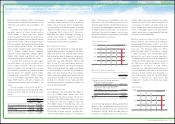
Consolidated Segment Information
Yen in millions % change
2006 2007 2008 2009 2010 2011 2011 vs. 2010
Business Segment:
Net Revenues:
Automotive ¥19,338,144 ¥21,928,006 ¥24,177,306 ¥18,564,723 ¥17,197,428 ¥17,337,320 +0.8
Financial Services 996,909 1,300,548 1,498,354 1,377,548 1,245,407 1,192,205 −4.3
All Other 1,190,291 1,323,731 1,346,955 1,184,947 947,615 972,252 +2.6
Intersegment Elimination (488,435) (604,194) (733,375) (597,648) (439,477) (508,089) —
Consolidated ¥21,036,909 ¥23,948,091 ¥26,289,240 ¥20,529,570 ¥18,950,973 ¥18,993,688 +0.2
Operating Income (Loss):
Automotive ¥ 1,694,045 ¥ 2,038,828 ¥ 2,171,905 ¥ (394,876) ¥ (86,370) ¥ 85,973 —
Financial Services 155,817 158,495 86,494 (71,947) 246,927 358,280 +45.1
All Other 39,748 39,679 33,080 9,913 (8,860) 35,242 —
Intersegment Elimination (11,268) 1,681 (21,104) (4,101) (4,181) (11,216) —
Consolidated ¥ 1,878,342 ¥ 2,238,683 ¥ 2,270,375 ¥ (461,011) ¥ 147,516 ¥ 468,279 +217.4
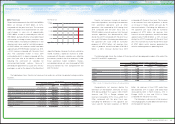
Geographic Segment:
Net Revenues:
Japan ¥13,111,457 ¥14,815,282 ¥15,315,812 ¥12,186,737 ¥11,220,303 ¥10,986,246 −2.1
North America 7,687,942 9,029,773 9,423,258 6,222,914 5,670,526 5,429,136 −4.3
Europe 2,727,409 3,542,193 3,993,434 3,013,128 2,147,049 1,981,497 −7.7
Asia 2,042,806 2,225,528 3,120,826 2,719,329 2,655,327 3,374,534 +27.1
Other 1,601,736 1,922,742 2,294,137 1,882,900 1,673,861 1,809,116 +8.1
Intersegment Elimination (6,134,441) (7,587,427) (7,858,227) (5,495,438) (4,416,093) (4,586,841) —
Consolidated ¥21,036,909 ¥23,948,091 ¥26,289,240 ¥20,529,570 ¥18,950,973 ¥18,993,688 +0.2
Operating Income (Loss):
Japan ¥ 1,075,890 ¥ 1,457,246 ¥ 1,440,286 ¥ (237,531) ¥ (225,242) ¥ (362,396) —
North America 495,638 449,633 305,352 (390,192) 85,490 339,503 +297.1
Europe 93,947 137,383 141,571 (143,233) (32,955) 13,148 —
Asia 145,546 117,595 256,356 176,060 203,527 312,977 +53.8
Other 67,190 83,497 143,978 87,648 115,574 160,129 +38.6
Intersegment Elimination 131 (6,671) (17,168) 46,237 1,122 4,918 +338.3
Consolidated ¥ 1,878,342 ¥ 2,238,683 ¥ 2,270,375 ¥ (461,011) ¥ 147,516 ¥ 468,279 +217.4
Toyota Motor Corporation
Fiscal years ended March 31
43
TOYOTA ANNUAL REPORT 2011