Toyota 2011 Annual Report Download - page 39
Download and view the complete annual report
Please find page 39 of the 2011 Toyota annual report below. You can navigate through the pages in the report by either clicking on the pages listed below, or by using the keyword search tool below to find specific information within the annual report.-
 1
1 -
2
-
3
-
4
-
5
-
6
-
7
-
8
-
9
-
10
-
11
-
12
-
13
-
14
-
15
-
16
-
17
-
18
-
19
-
20
-
21
-
22
-
23
-
24
-
25
-
26
-
27
-
28
-
 29
29 -
 30
30 -
 31
31 -
 32
32 -
 33
33 -
 34
34 -
 35
35 -
 36
36 -
 37
37 -
 38
38 -
 39
39 -
 40
40 -
 41
41 -
 42
42 -
 43
43 -
 44
44 -
 45
45 -
 46
46 -
 47
47 -
 48
48 -
 49
49 -
50
-
51
-
52
-
53
-
54
-
55
-
56
-
57
-
58
-
59
-
60
-
61
-
62
-
63
-
64
-
65
-
66
-
67
-
68
-
69
-
70
-
71
-
72
-
73
-
74
-
75
-
76
-
77
-
78
-
79
-
80
-
81
-
82
-
83
-
84
-
85
-
86
-
87
-
88
-
89
-
90
-
91
-
92
-
93
-
94
-
95
-
96
-
97
-
98
-
99
-
100
-
101
-
102
-
103
-
104
-
105
-
106
-
107
-
108
-
109
-
110
-
111
-
112
-
113
 |
 |

Financial Section and
Investor Information
Business and
Performance Review
Special FeatureMessage/Vision
Management and
Corporate Information
0729
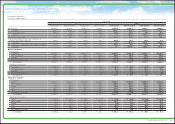
On a consolidated basis for the fiscal year ended March 31, 2011,
year-on-year vehicle sales improved 71 thousand units to 7,308 thousand
units, and net revenues increased 0.2% to ¥18,993.6 billion. Operating
income rose ¥320.7 billion to ¥468.2 billion, whereas net income
advanced ¥198.7 billion to ¥408.1 billion. As a result, Toyota succeeded
in increasing both revenue and income.
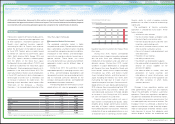
Factors contributing to the increase in operating income included
¥490.0 billion from marketing efforts (including ¥130.0 billion from our
financial services operations) and ¥180.0 billion from our continuous
cost-reduction efforts, including companywide VA (Value Analysis)
activities. Major factors reducing income were exchange rate fluctua-
tions, amounting to ¥290.0 billion, increases in expenses, etc., of ¥30.0
billion, and other factors reducing income that amounted to ¥29.3 billion.
In Japan, subsidies for eco-car purchases ended, which had a negative
effect on income, and vehicle sales were drastically down due to the
earthquake of March 11. Nonetheless, sales of IMVs were strong,
especially in Asian countries such as Thailand and Indonesia, reaching
their highest levels ever for the full year and contributing to an increase
in income. The negative impact of the Great East Japan Earthquake on
income amounted to ¥110.0 billion: ¥100.0 billion was due to operating
factors such as reduced vehicle sales as a result of reduced production
and the recording of allowances for our financial services business; other
factors contributing to a ¥10.0 billion reduction in income were decreased
cost reduction associated with lower unit sales and an increase in costs.
Taking the above into consideration, we view the increase in income for
the fiscal year ended March 31, 2011, as offsetting two major impacts
that reduced income, namely, the rapid and steep increase in the value
of the yen and the Great East Japan Earthquake.
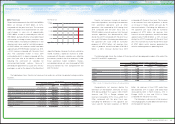
Although I have noted previously that in the fiscal year ended March
31, 2010, we succeeded in broadly lowering our break-even point, we
continued to make structural improvements during the fiscal year ended
March 31, 2011, so if we leave out temporary factors such as the impact
of the earthquake, I believe we have succeeded in creating “a structure
that generates profits even with the exchange rate at ¥85 to the U.S.
dollar, and consolidated unit sales of 6.6 million.” We will continue to put
strong efforts into marketing, as well as work to achieve cost reductions
by holding down fixed costs and conducting companywide VA efforts so
as to improve our profitability.
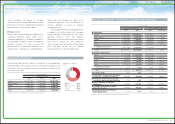
For the fiscal year ending March 31, 2012, we forecast vehicle sales of
7.24 million units, net revenues of ¥18,600.0 billion, operating income of
¥300.0 billion and net income of ¥280.0 billion on a consolidated basis.
The exchange rates assumed for this forecast are ¥82 per US$1 and
¥115 per €1.
Factors that are expected to increase income include cost-reduction
efforts amounting to ¥100.0 billion. Factors that are expected to cause a
decrease in income include the effect of exchange rate fluctuations
amounting to ¥100.0 billion, sales volume/mix effects totaling ¥120.0
billion and an increase in expenses, etc., reaching ¥48.2 billion. In terms
of the impact in the next fiscal year of the Great East Japan Earthquake,
we expect a decrease in unit sales, including a surplus after recovery to
regular production levels amounting to ¥320.0 billion and decreased cost
reduction amounting to ¥40.0 billion, for a total impact of ¥360.0 billion.
Despite temporary factors such as the effect of the disaster, I believe we
are making steady progress toward achieving the goal set forth in our
Global Vision of building solid profitability by which we can consistently
achieve a return to profitability in nonconsolidated operating income,
with a consolidated operating margin of 5% and operating income of
around ¥1 trillion even under such severe conditions as an exchange
rate of ¥85 to the U.S. dollar, and consolidated unit sales of 7.5 million.
I believe that the profitability called for in the Global Vision represents
a “bottom line for sustainable growth,” which means creating a structure
that will generate earnings even in the event of another economic
downturn that, for example, results in a 20% decline in unit sales. Doing
so means creating a stable business base by creating “better cars” that
are accepted by our customers and society, and contributing to “enriching
lives of communities,” which will result in winning the hearts of a growing
number of customers. By fostering that kind of virtuous cycle we can
realize sustainable growth and increase our corporate value.
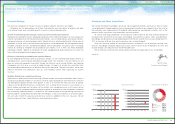
Fiscal 2011 Business Results
Consolidated Financial Forecasts for Fiscal 2012
Message from the Executive Vice President Responsible for Accounting
39TOYOTA ANNUAL REPORT 2011